

The market remains under pressure from escalating geopolitical tensions in the Persian Gulf region and the continued risk of Yemen's Houthi forces disrupting shipping through the Bab el-Mandeb Strait, an important route for Middle Eastern oil exports via the Red Sea. In addition, investor sentiment is being influenced by uncertainty surrounding the Federal Reserve's monetary policy outlook amid signs of stabilising inflation and a cooling labour market. According to the CME FedWatch Tool, the probability of keeping interest rates unchanged at the October meeting was estimated at 82.8%, suggesting that policymakers are likely to pause before considering further tightening later this year.
Next week marks the beginning of a key corporate earnings reporting period, with financial results from major US banks and investment companies among the first to be released. Analysts expect some moderation compared with the exceptionally strong previous quarter. JPMorgan Chase & Co. is forecast to report revenue of approximately $50.99 billion, compared with $57.35 billion in the second quarter, while earnings per share (EPS) may decline from $7.70 to $5.89. Similar expectations apply to The Goldman Sachs Group Inc., whose quarterly revenue is projected to decrease from $20.34 billion to $17.15 billion, with EPS expected to fall from $20.98 to $14.50. However, these forecasts primarily reflect a sequential slowdown from strong second-quarter results rather than necessarily indicating weaker year-on-year performance.
Meanwhile, US government bond yields have retreated slightly from their recent multi-decade highs, providing some relief to equity markets. The yield on benchmark 10-year Treasury securities has declined from around 5.28% to approximately 5.22–5.23%, while the 20-year yield is trading near 5.65% after reaching around 5.71% earlier in the week. The yield on long-term 30-year bonds has also eased from approximately 5.68% to around 5.61%. Nevertheless, borrowing costs remain elevated and continue to limit the potential for a stronger stock market recovery.
As discussed in our previous Dow Jones forecast, expectations surrounding Federal Reserve monetary policy and incoming US economic data remain important drivers of short-term movements in the index.
Among the strongest performers in the latest trading session were Home Depot Inc. (+3.39%), Chevron Corp. (+3.12%), IBM Corp. (+2.77%), The Travelers Companies Inc. (+2.68%) and McDonald's Corp. (+2.61%).
The largest declines were recorded by Nvidia Corp. (–2.94%), Amazon.com Inc. (–2.25%), Caterpillar Inc. (–2.17%), Cisco Systems Inc. (–2.13%) and Amgen Inc. (–1.37%).
Support and resistance levels
On the daily chart, the trading instrument is attempting to retreat from the resistance line of the local descending channel with dynamic boundaries of 51500.0–49700.0.
Technical indicators have been strengthening the sell signal since the beginning of the month: the fluctuation range of the Alligator indicator's EMAs is widening to the downside, while the AO histogram is forming corrective bars in negative territory.
Support levels: 50880.0, 49720.0.
Resistance levels: 51660.0, 53000.0.
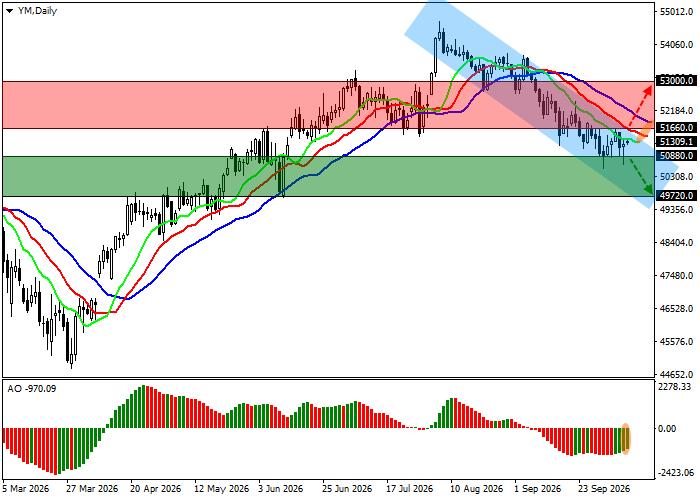
Dow Jones trading scenarios and DJIA forecast
Short positions may be opened after the price declines and consolidates below 50880.0, with a target at 49720.0. Stop-loss — 51300.0. Estimated implementation period: 7 days or more.
Long positions may be opened after the price rises and consolidates above 51660.0, with a target near 53000.0 and a stop-loss at 51000.0.
Scenario
| Timeframe | Weekly |
| Recommendation | SELL STOP |
| Entry point | 50880.0 |
| Take Profit | 49720.0 |
| Stop Loss | 51300.0 |
| Key levels | 49720.0, 50880.0, 51660.0, 53000.0 |
Alternative scenario
| Recommendation | BUY STOP |
| Entry point | 51660.0 |
| Take Profit | 53000.0 |
| Stop Loss | 51000.0 |
| Key levels | 49720.0, 50880.0, 51660.0, 53000.0 |
