

The British Retail Consortium’s report, released on November 10, showed modest growth in consumer spending. Total retail sales increased by 1.5% year on year in October, compared with 1.3% in September and 1.6% in October 2025. Food sales rose 3.2%, against 3.5% a year earlier, while non-food sales were unchanged. In-store non-food sales fell 1.1%, compared with growth of 0.1% a year earlier. Online non-food sales increased by 1.8%, against flat sales in October 2025 and a three-month average growth rate of 0.8%. Online purchases accounted for 38.6% of non-food sales, up from 38.2% a year earlier. These figures measure spending in monetary terms rather than sales volumes.
UK government bond yields have also edged lower. The one-year yield was quoted at 4.513%, compared with 4.551% in the previous week. The benchmark 10-year yield stood at 5.130%, against 5.167% on Friday, while the 20-year yield eased to 5.548% from 5.574%. The 30-year yield was 5.588%, below the earlier reference of 5.611%.
Among the leading gainers in the November 9 session were Antofagasta PLC (+6.17%), Anglo American PLC (+5.21%), Fresnillo PLC (+4.97%), Babcock International Group PLC (+4.77%) and Rolls-Royce Holdings PLC (+4.71%).
Decliners included Imperial Brands PLC (–2.49%), Haleon PLC (–2.39%), Whitbread PLC (–2.26%), British American Tobacco PLC (–1.97%) and Smith & Nephew PLC (–1.77%).
Support and resistance levels
On the daily chart, the index is attempting to move away from the support line of a broader ascending channel with boundaries at 10500.0–11800.0. The recovery follows the broader structure discussed in our previous FTSE 100 analysis.
Technical indicators are strengthening a tentative buy signal: the Alligator indicator’s moving averages are widening their spread, while the Awesome Oscillator histogram forms corrective bars in positive territory.
Support levels: 10770.0, 10580.0.
Resistance levels: 10880.0, 11080.0.
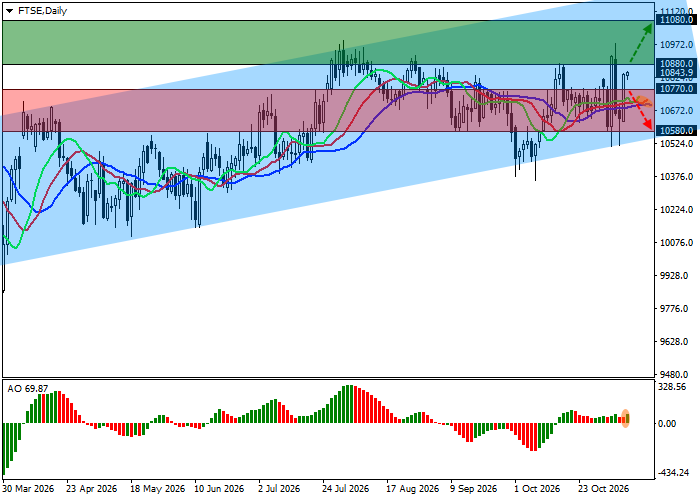
Trading scenarios and FTSE 100 forecast
Long positions may be opened after the index rises and holds above 10880.0, targeting 11080.0, with a stop-loss at 10800.0. Implementation period: 7 days or more.
Short positions may be opened after the index declines and holds below 10770.0, targeting 10580.0, with a stop-loss at 10870.0.
Scenario
| Timeframe | Weekly |
| Recommendation | BUY STOP |
| Entry point | 10880.0 |
| Take Profit | 11080.0 |
| Stop Loss | 10800.0 |
| Key levels | 10580.0, 10770.0, 10880.0, 11080.0 |
Alternative scenario
| Recommendation | SELL STOP |
| Entry point | 10770.0 |
| Take Profit | 10580.0 |
| Stop Loss | 10870.0 |
| Key levels | 10580.0, 10770.0, 10880.0, 11080.0 |
