

On November 5, the Bank raised its policy rate from 3.75% to 4.00%. Governor Andrew Bailey indicated that another increase could be needed if energy prices remained elevated, with inflationary effects potentially persisting even after a rapid easing of tensions in the Persian Gulf. This stance supported the pound, but stronger US data subsequently triggered a sharp correction. October unemployment edged down from 4.2% to 4.1%, while nonfarm payrolls increased by 165,000, exceeding the 65,000 forecast and September’s revised gain of 60,000. Monthly average hourly earnings growth accelerated from 0.3% to 0.4%. The figures reinforced expectations of further Federal Reserve tightening. Ahead of the November 10 US inflation release, CME FedWatch indicated an 82.2% probability of a December rate hike.
GBP/USD has since recovered. October figures from the British Retail Consortium showed annual like-for-like retail sales growth edging up from 1.0% to 1.1%, below the 1.2% forecast. Total retail sales increased by 1.5%, compared with 1.3% in September. Food sales rose 3.2% year on year, while non-food sales were unchanged. These figures measure sales value rather than volumes and point to modest spending growth as households face higher costs and delay purchases ahead of Black Friday. Meanwhile, speaking in Zurich on November 9, Bailey encouraged greater trade openness and market access, including with the EU. Prime Minister Andy Burnham’s government is also pursuing closer economic ties with the bloc following Brexit.
Overall, the pair retains medium-term upside potential, subject to confirmation above nearby resistance.
Support and resistance levels
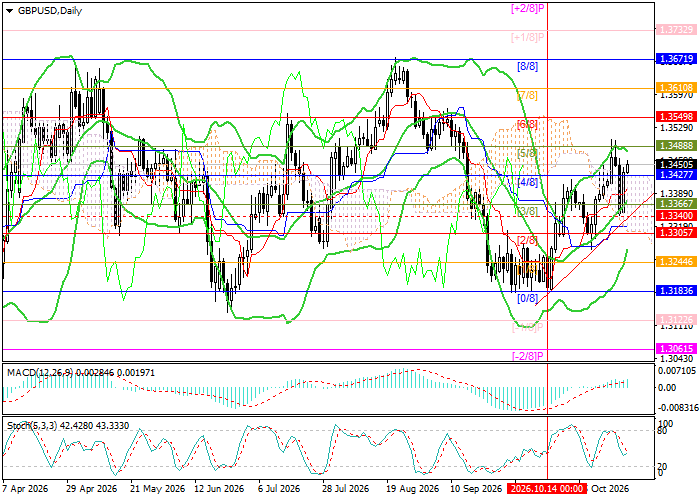
GBP/USD remains within the broad sideways range of 1.3183–1.3671 (Murrey Math [0/8]–[8/8]), established late last year. The pair is approaching the upper Bollinger Band near 1.3488 (Murrey Math [5/8]), a resistance area also examined in our previous GBP/USD analysis. A sustained break above it could open the way toward 1.3671 (Murrey Math [8/8]) and 1.3793 ([+2/8]). Conversely, a break below 1.3305 (Murrey Math [2/8]) could trigger a decline toward 1.3183 ([0/8]), 1.3061 ([–2/8]) and 1.2939 ([2/8] on the weekly chart).
Technical indicators maintain a buy signal: the Bollinger Bands are turning upward, the MACD histogram is expanding in positive territory, and the Stochastic oscillator is also attempting to turn higher.
Resistance levels: 1.3488, 1.3671, 1.3793.
Support levels: 1.3305, 1.3183, 1.3061, 1.2939.
Trading scenarios and GBP/USD forecast
Long positions may be opened above 1.3488, targeting 1.3671 and 1.3793, with a stop-loss at 1.3400. Implementation period: 5–7 days.
Short positions may be opened below 1.3305, targeting 1.3183, 1.3061 and 1.2939, with a stop-loss at 1.3380.
Scenario
| Timeframe | Weekly |
| Recommendation | BUY STOP |
| Entry point | 1.3488 |
| Take Profit | 1.3671, 1.3793 |
| Stop Loss | 1.3400 |
| Key levels | 1.2939, 1.3061, 1.3183, 1.3305, 1.3488, 1.3671, 1.3793 |
Alternative scenario
| Recommendation | SELL STOP |
| Entry point | 1.3305 |
| Take Profit | 1.3183, 1.3061, 1.2939 |
| Stop Loss | 1.3380 |
| Key levels | 1.2939, 1.3061, 1.3183, 1.3305, 1.3488, 1.3671, 1.3793 |
