

The Democratic victory in both chambers of Congress raised expectations of greater political pressure on the US administration to limit the conflict with Iran. The sell-off discussed in our previous WTI oil forecast took prices toward the 86.00 area before a partial recovery. Prices are now under renewed pressure after President Donald Trump said in an interview with CNN that renewed military action was highly unlikely if peace negotiations made progress. However, he did not rule out strikes against Iranian infrastructure if necessary. Additional pressure comes from JPMorgan Chase & Co.’s latest assessment, which suggests that recovering Middle Eastern exports, rising production elsewhere, and weaker demand have returned the global oil market to surplus. The bank estimated excess supply at 1.1 million barrels per day in September and 1.4 million barrels per day in October.
Despite some positive signals, the geopolitical situation in the Persian Gulf remains tense. Reports of attacks on commercial shipping continue, with Iran reporting further tanker incidents over the weekend. Houthi attacks on Saudi Arabia also sustain concerns about infrastructure security. On Sunday, falling debris damaged a Saudi Aramco administrative building in Riyadh, according to the Saudi Energy Ministry.
Overall, analysts expect oil prices to retain a geopolitical risk premium over the medium term despite the current correction, limiting the potential for a return to pre-conflict levels.
Support and Resistance Levels
The instrument is approaching the lower Bollinger Band at 87.50 (Murray level [4/8]). Consolidation below this mark could extend the decline toward 81.25 (Murray level [2/8]) and 77.10 (61.8% Fibonacci retracement). However, consolidation above the middle Bollinger Band at 96.87 (Murray level [7/8]) could support a recovery toward 103.12 (Murray level [+1/8]) and 106.25 (Murray level [+2/8]).
Technical indicators provide mixed signals: the Bollinger Bands are turning horizontal after rising, the MACD histogram is preparing to move into negative territory, and the Stochastic oscillator has reached the oversold zone and could turn upward.
Resistance levels: 96.87, 103.12, 106.25.
Support levels: 87.50, 81.25, 77.10.
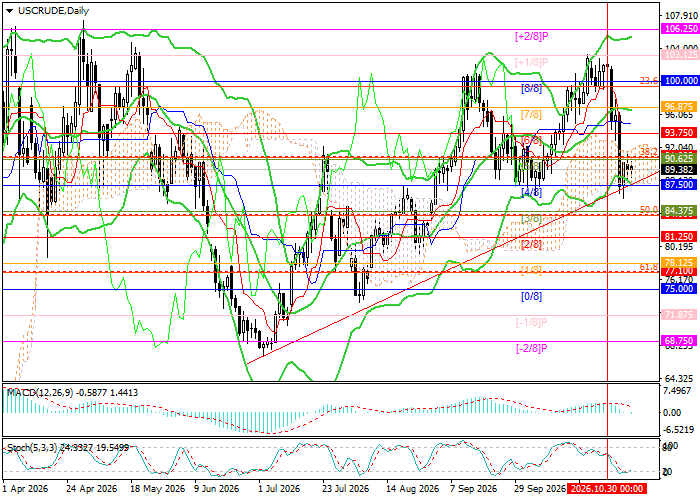
WTI Crude Oil Trading Scenarios and Price Forecast
Short positions may be considered below 87.50, with targets at 81.25 and 77.10 and a stop-loss at 91.80. The estimated holding period is 5–7 days. Long positions may be considered above 96.87, with targets at 103.12 and 106.25 and a stop-loss at 93.00.
Scenario
| Timeframe | Weekly |
| Recommendation | SELL STOP |
| Entry Point | 87.50 |
| Take Profit | 81.25, 77.10 |
| Stop Loss | 91.80 |
| Key Levels | 77.10, 81.25, 87.50, 96.87, 103.12, 106.25 |
Alternative Scenario
| Recommendation | BUY STOP |
| Entry Point | 96.87 |
| Take Profit | 103.12, 106.25 |
| Stop Loss | 93.00 |
| Key Levels | 77.10, 81.25, 87.50, 96.87, 103.12, 106.25 |
