

UK equities have remained relatively resilient amid weakness across European markets, although softer lending activity and mixed corporate results remain potential headwinds. According to the Bank of England’s September Money and Credit report, net mortgage approvals for house purchases declined to 53.4K from 54.8K in August. Net mortgage borrowing decreased to £3.9 billion from £4.2 billion, while net consumer credit borrowing fell to £1.9 billion from £2.7 billion. The implications of subdued domestic demand for UK equities were also discussed in our earlier FTSE 100 analysis.
Corporate earnings have presented a mixed picture. Lloyds Banking Group Plc reported third-quarter net income of £5.072 billion, up 9% year-on-year, and statutory profit before tax of £2.332 billion. Earnings per share were 2.8 pence, while the group maintained its full-year guidance. In the wider international earnings picture, Nasdaq-listed industrial gases company Linde Plc reported quarterly sales of $9.404 billion and adjusted diluted EPS of $4.59. Its GAAP diluted EPS was $3.66. Linde’s results provide broader industrial-sector context rather than a direct contribution to FTSE 100 earnings.
UK government bond yields eased in the supplied market snapshot. The one-year yield stood at 4.623%, compared with an earlier reference of 4.661%. The benchmark 10-year gilt yield declined to 5.300% from 5.367%, while the 20-year yield eased to 5.685% from 5.743%. The 30-year yield stood at 5.705%, compared with 5.741% in the previous week.
Among the gainers in the supplied equity-market snapshot were 3i Group Plc (+3.27%), London Stock Exchange Group Plc (+2.81%), ICG Plc (+2.61%), Melrose Industries Plc (+2.57%) and AstraZeneca Plc (+2.26%).
Decliners included Haleon Plc (–15.05%), Lloyds Banking Group Plc (–5.04%), St. James’s Place Plc (–3.68%), Rio Tinto Plc (–2.93%) and Diageo Plc (–2.07%).
Support and Resistance Levels
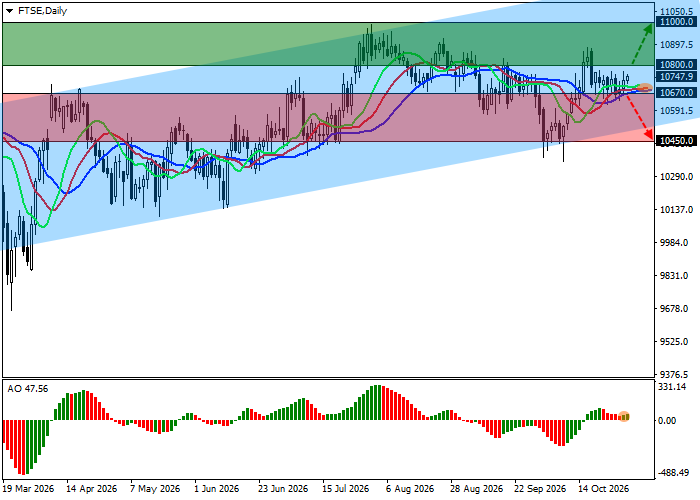
On the daily chart, the index is undergoing a local correction within a broader ascending channel with approximate boundaries at 10600.0–11600.0. The supplied price of 10747.0 places it in the lower part of this range, with nearer-term resistance at 10800.0.
Technical indicators maintain a tentative buy signal that has weakened during the correction: the spread between the exponential moving averages (EMAs) of the Alligator indicator is gradually narrowing, while the Awesome Oscillator (AO) histogram is forming corrective bars in positive territory.
Support levels: 10670.0, 10450.0.
Resistance levels: 10800.0, 11000.0.
FTSE 100 Trading Scenarios and Index Forecast
Long positions may be opened after the price rises and consolidates above 10800.0, with a target at 11000.0 and a stop-loss at 10700.0. Estimated holding period: 7 days or more.
Short positions may be opened after the price declines and consolidates below 10670.0, with a target at 10450.0. Stop-loss: 10750.0.
Scenario
| Timeframe | Weekly |
| Recommendation | BUY STOP |
| Entry Point | 10800.0 |
| Take Profit | 11000.0 |
| Stop Loss | 10700.0 |
| Key Levels | 10450.0, 10670.0, 10800.0, 11000.0 |
Alternative Scenario
| Recommendation | SELL STOP |
| Entry Point | 10670.0 |
| Take Profit | 10450.0 |
| Stop Loss | 10750.0 |
| Key Levels | 10450.0, 10670.0, 10800.0, 11000.0 |
