

Renewed selling quickly overwhelmed the latest rebound, pushing prices back toward late-August lows near 90.00. The main pressure comes from expectations that peace negotiations between the United States and Iran will continue, easing concerns about further supply disruptions. Diplomatic expectations were also discussed in our previous Brent crude oil analysis. Meanwhile, releases from the US Strategic Petroleum Reserve continue to supplement market supply. Department of Energy figures reported on Monday put reserve stocks at 279.5 million barrels, their lowest level since October 1982. Further declines remain possible as scheduled deliveries continue through November and December.
The American Petroleum Institute’s next weekly report is due on November 10 at 21:30 GMT (23:30 GMT+2). A draw of 2.200 million barrels is anticipated, following the previous week’s 5.267 million-barrel decline. The Energy Information Administration’s Weekly Petroleum Status Report is scheduled for Thursday, November 12, at 17:00 GMT (19:00 GMT+2), delayed by the Veterans Day holiday. Commercial crude inventories are expected to fall by 1.800 million barrels after the previous decline of 0.865 million barrels. If realised, this would mark a sixth consecutive weekly draw.
Support and resistance levels
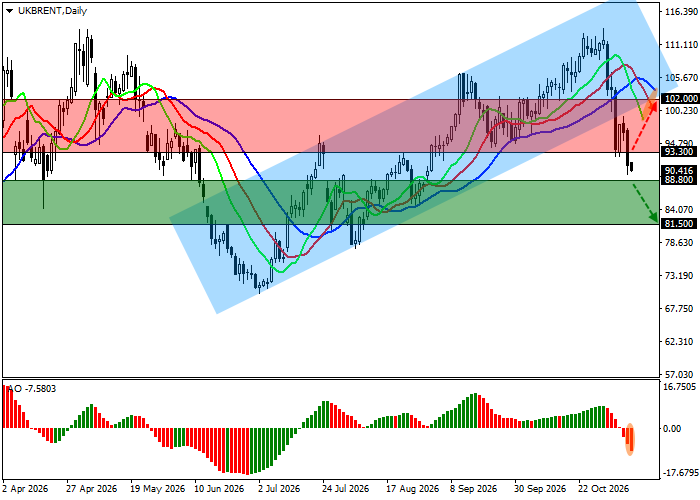
On the daily chart, the instrument remains well below the support line of the broader ascending channel with boundaries at 120.00–100.00.
Technical indicators are strengthening their sell signal: the Alligator indicator’s fast moving averages remain below the slower lines and continue to move away from them, while the Awesome Oscillator histogram forms corrective bars in negative territory.
Support levels: 88.80, 81.50.
Resistance levels: 93.30, 102.00.
Trading scenarios and Brent crude oil forecast
Short positions may be opened after the price declines and holds below 88.80, targeting 81.50, with a stop-loss at 92.00. Implementation period: 7 days or more. Long positions may be opened after the price rises and holds above 93.30, targeting 102.00, with a stop-loss at 88.00.
Scenario
| Timeframe | Weekly |
| Recommendation | SELL STOP |
| Entry point | 88.80 |
| Take Profit | 81.50 |
| Stop Loss | 92.00 |
| Key levels | 81.50, 88.80, 93.30, 102.00 |
Alternative scenario
| Recommendation | BUY STOP |
| Entry point | 93.30 |
| Take Profit | 102.00 |
| Stop Loss | 88.00 |
| Key levels | 81.50, 88.80, 93.30, 102.00 |
