

The October US employment report showed unemployment edging down from 4.2% to 4.1%. Nonfarm payrolls increased by 165,000, exceeding both the 65,000 forecast and September’s revised gain of 60,000, while monthly average hourly earnings growth accelerated from 0.3% to 0.4%. A resilient labour market gives the Federal Reserve more room to address persistent inflation under its dual mandate. San Francisco Fed President Mary Daly said further tightening would likely be needed, although its timing and extent remained undecided. St. Louis Fed President Alberto Musalem also stressed the importance of bringing inflation down. Ahead of the November 10 US inflation release, CME FedWatch indicated an 82.2% probability of a December rate hike.
Nevertheless, EUR/USD subsequently recovered its losses as signs of easing tensions in the Persian Gulf reduced demand for the US dollar as a haven. In a November 8 interview with CNN, President Donald Trump said renewed military action against Iran was highly unlikely if negotiations continued to make progress. His comments encouraged hopes of fewer disruptions to Middle Eastern oil supplies, potentially easing the energy crisis and inflation pressures. This shift in expectations weighed on the dollar.
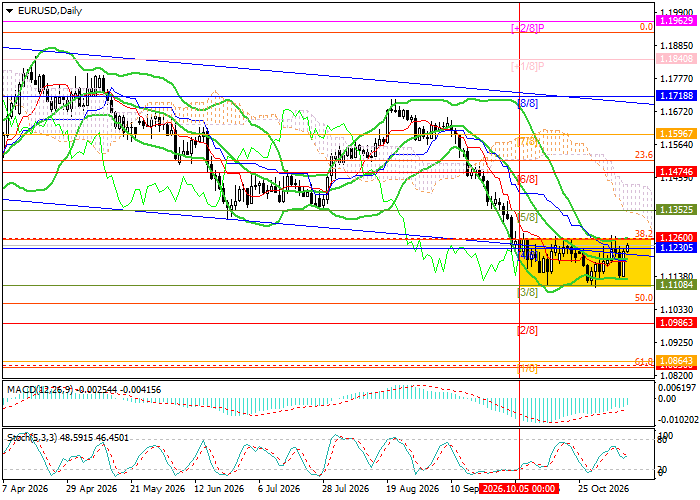
The euro also found some support from stronger German exports. September exports rose 2.0% month on month, exceeding forecasts of 0.5%, while imports increased 4.2% against expectations of 0.5%. Faster import growth nevertheless narrowed the trade surplus from a revised €17.9 billion to €15.6 billion. Overall, continued consolidation around 1.1108–1.1260 remains a plausible near-term scenario while traders await stronger directional catalysts.
Support and resistance levels
The pair is approaching the upper Bollinger Band near 1.1260, also corresponding to the 38.2% Fibonacci retracement. A sustained break above this level could open the way toward 1.1474 (Murrey Math [6/8]), 1.1596 ([7/8]) and 1.1718 ([8/8], the upper boundary of the descending channel). Conversely, a break below 1.1108 (Murrey Math [3/8]) could expose 1.0986 ([2/8]) and 1.0850 (61.8% Fibonacci retracement). These breakout levels remain consistent with our previous EUR/USD analysis.
Technical indicators remain mixed: the Bollinger Bands are flattening after declining, the negative MACD histogram bars are shrinking, and the Stochastic oscillator is turning lower.
Resistance levels: 1.1260, 1.1474, 1.1596, 1.1718.
Support levels: 1.1108, 1.0986, 1.0850.
Trading scenarios and EUR/USD forecast
Long positions may be opened on a move through 1.1300, targeting 1.1474, 1.1596 and 1.1718, with a stop-loss at 1.1220. Implementation period: 5–7 days.
Short positions may be opened below 1.1108, targeting 1.0986 and 1.0850, with a stop-loss at 1.1190.
Scenario
| Timeframe | Weekly |
| Recommendation | BUY STOP |
| Entry point | 1.1300 |
| Take Profit | 1.1474, 1.1596, 1.1718 |
| Stop Loss | 1.1220 |
| Key levels | 1.0850, 1.0986, 1.1108, 1.1260, 1.1474, 1.1596, 1.1718 |
Alternative scenario
| Recommendation | SELL STOP |
| Entry point | 1.1108 |
| Take Profit | 1.0986, 1.0850 |
| Stop Loss | 1.1190 |
| Key levels | 1.0850, 1.0986, 1.1108, 1.1260, 1.1474, 1.1596, 1.1718 |
