

Over the weekend, Iran’s negotiating delegation announced the suspension of all channels of indirect dialogue with the United States in protest against the ongoing military operations of the Israel Defense Forces in Lebanon and the Gaza Strip. Iran’s state news agency Tasnim confirmed that Tehran and its allies in the “axis of resistance,” including Yemen’s Houthis, the Lebanese paramilitary group Hezbollah, and Iraqi militia formations, have developed an agenda for a complete blockade of the Strait of Hormuz and are ready to close the Bab el-Mandeb Strait off the coast of Yemen. At the same time, on Monday, U.S. President Donald Trump said in an interview with ABC News that, in his opinion, the sides could reach consensus on resuming traffic through the key waterway as early as next week, noting that several issues still need to be resolved before a deal can be concluded. On Truth Social, he also said that Israel had agreed with Hezbollah on a mutual ceasefire and troop withdrawal. However, Tel Aviv has not officially confirmed the ceasefire, while Tehran insists that there has been no progress in the negotiations and demands the withdrawal of Israeli forces from Lebanese territory.
Meanwhile, according to the latest data from the U.S. Energy Information Administration, fuel reserves fell by 333.0K barrels to 443.0 million barrels, while inventories in Cushing declined by 2.79 million barrels amid stable demand and an increase in refinery utilization by 2.9 percentage points to the highest level since the beginning of the year at 94.5%. Production remains at a record high of 13.72 million barrels per day, up 10.0K barrels per day from the previous week, while the number of active drilling rigs increased by 4 units to 429. According to analysts’ estimates, crude oil exports rose to a record 5.6 million barrels per day in May, as Asian and European producers increased purchases of alternative supplies amid the blockade of the Strait of Hormuz. This partially offset the shortage caused by disruptions in supplies from the Persian Gulf region, but at the same time accelerated the decline in domestic inventories.
At the same time, market supply is increasing not only due to higher production in the United States. Seven key OPEC+ countries — Saudi Arabia, Iraq, Kuwait, Kazakhstan, Russia, Algeria, and Oman — adjusted their production quotas from April to June by almost 600.0K barrels per day, and according to sources, another increase of around 188.0K barrels per day is being prepared for July. The next meeting of the organization’s ministerial monitoring committee is scheduled for June 7, where the alliance is likely to confirm its course toward a gradual rollback of voluntary restrictions.
Support and resistance levels
On the daily chart, Bollinger Bands are confidently declining: the price range is expanding downward, opening the way for bears toward new local lows. The MACD indicator is trying to form a buy signal, with the histogram attempting to consolidate above the signal line, while Stochastic is rising in the middle of the working area, indicating sufficient potential for further development of the upward correction.
Resistance levels: 90.00, 91.93, 93.97, 96.00.
Support levels: 88.67, 86.95, 85.00, 83.00.
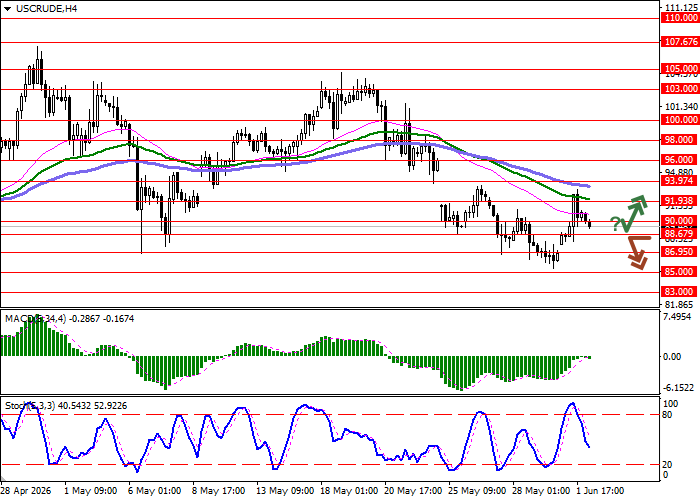
WTI Crude Oil trading scenarios and forecast
Short positions may be opened after a breakout below 88.67, with a target at 85.00. Stop-loss — 90.50. Expected timeframe: 1–2 days.
Long positions may be opened after a rebound from 88.67 and a breakout above 90.00, with a target at 93.97. Stop-loss — 88.00.
Scenario
| Timeframe | Intraday |
| Recommendation | SELL STOP |
| Entry point | 88.65 |
| Take Profit | 85.00 |
| Stop Loss | 90.50 |
| Key levels | 83.00, 85.00, 86.95, 88.67, 90.00, 91.93, 93.97, 96.00 |
Alternative scenario
| Recommendation | BUY STOP |
| Entry point | 90.05 |
| Take Profit | 93.97 |
| Stop Loss | 88.00 |
| Key levels | 83.00, 85.00, 86.95, 88.67, 90.00, 91.93, 93.97, 96.00 |
