
The May business activity index in the services sector accelerated from 53.6 points to a three-year high of 54.5 points, compared with expectations of 53.8 points. However, analysts are seriously concerned about the prices subindex, which reached its highest level since August 2022 at 71.3 points. Among the key factors behind higher costs, businesses most often cited rising diesel fuel, gasoline, and oil prices caused by the blockade of the Strait of Hormuz. U.S. Central Command confirmed that American forces intercepted several Iranian missiles and drones targeting regional facilities and carried out retaliatory measures aimed at destroying positions of the Islamic Revolutionary Guard Corps. Yesterday, President Donald Trump stated that official Tehran had abandoned its nuclear program and added that consultations involving Iran’s Supreme Leader Mojtaba Khamenei are continuing.
XAG/USD is supported by a persistent structural deficit in the silver market. The April review from the Silver Institute noted that in 2026 the market is facing a five-year record deficit of 46.3 million ounces, 15.0% higher than last year’s 40.3 million ounces. The cumulative deficit since 2021 has reached 762.0 million ounces, the highest level on record. This year, industrial demand is expected to decline by 2.0% to a four-year low of 650.0 million ounces amid developments in the photovoltaic sector, where, despite continued growth in solar panel deployment, the direct substitution of silver with cheaper materials is accelerating. Jewelry consumption is expected to fall by 9.0% to 178.0 million ounces, the lowest level since 2020, mainly due to high prices, while silverware and tableware demand may decline by 17.0%, with the main losses coming from India.
A correction continues in the silver contracts market. According to the latest report from the U.S. Commodity Futures Trading Commission, net speculative positions fell last week from 24.7K to 22.2K, while traders continue to hold a net long position, though slightly reduced. According to the report on real-money-backed transactions, the balance of bulls stands at 17.279K versus 7.035K for bears. Last week, buyers liquidated 1.257K contracts, while sellers increased their positions by 0.260K.
Support and resistance levels
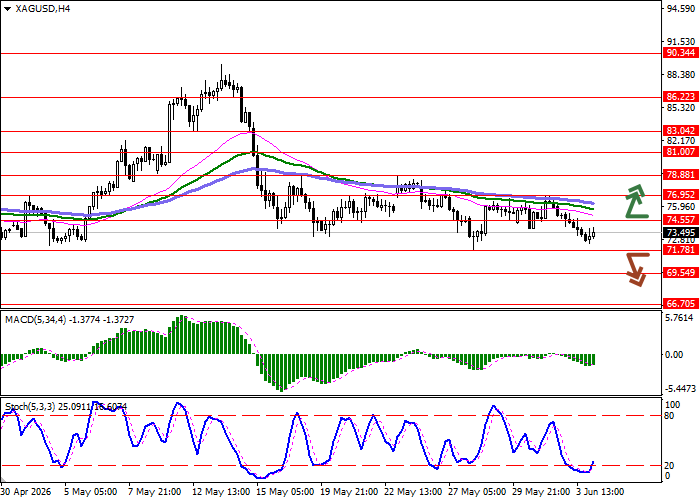
On the daily chart, Bollinger Bands are slightly declining: the price range is expanding downward, opening the way for bears toward new lows. The MACD indicator maintains a weak sell signal, with the histogram below the signal line, while Stochastic has turned downward in the middle of its working range.
Resistance levels: 74.55, 76.95, 78.88, 81.00.
Support levels: 71.78, 69.54, 66.70, 64.66.
XAG/USD trading scenarios and forecast
Short positions may be opened after a breakout below 71.78, with a target at 66.70. Stop-loss — 74.55. Expected timeframe: 2–3 days. Long positions may be opened after a breakout above 74.55, with a target at 78.88. Stop-loss — 71.78.
Scenario
| Timeframe | Intraday |
| Recommendation | SELL STOP |
| Entry point | 71.75 |
| Take Profit | 66.70 |
| Stop Loss | 74.55 |
| Key levels | 64.66, 66.70, 69.54, 71.78, 74.55, 76.95, 78.88, 81.00 |
Alternative scenario
| Recommendation | BUY STOP |
| Entry point | 74.60 |
| Take Profit | 78.88 |
| Stop Loss | 71.78 |
| Key levels | 64.66, 66.70, 69.54, 71.78, 74.55, 76.95, 78.88, 81.00 |
