

The Middle East conflict remains at the centre of investor attention, while the energy crisis caused by persistent geopolitical tensions in the region and renewed attacks involving Yemen’s Houthi forces and Saudi Arabia continues to act as a long-term inflationary factor.
In this environment, investors continue to maintain exposure to defensive assets, including gold. However, the precious metal faces strong competition from government bonds as their yields remain close to multi-decade highs. The yield on benchmark 10-year US Treasury securities has climbed to around 5.30%, its highest level since 2002, increasing the opportunity cost of holding non-yielding gold and limiting the accumulation of long positions in XAU/USD.
Nevertheless, gold continues to retain its safe-haven role amid geopolitical uncertainty, elevated government debt and persistent inflation risks. Central-bank demand also remains an important source of long-term support for the precious metal.
In the longer term, XAU/USD maintains a positive fundamental backdrop, supported by strong global demand for physical and investment gold. According to the latest World Gold Council (WGC) report, global gold-backed exchange-traded fund holdings reached a record 4,189 tonnes in August after increasing by 121 tonnes during the month.
Gold-backed ETFs attracted approximately $18.0 billion in August, the second-largest monthly inflow in value terms on record. Combined with higher gold prices, these inflows lifted global gold ETF assets under management by 16.0% month-on-month to approximately $615.0 billion. August alone accounted for more than 60% of total gold ETF inflows recorded since the beginning of the year.
As discussed in our previous XAU/USD forecast, geopolitical instability and continued demand for defensive assets remain important sources of support for gold, even as elevated bond yields limit its upside potential.
Support and resistance levels
On the daily chart, the trading instrument is correcting below the resistance line of the local descending channel with dynamic boundaries of 4230.0–3900.0.
Technical indicators are strengthening the sell signal: the fast EMAs of the Alligator indicator remain below the slow ones, while the AO histogram is forming corrective bars in negative territory.
Support levels: 4080.0, 3880.0.
Resistance levels: 4220.0, 4480.0.
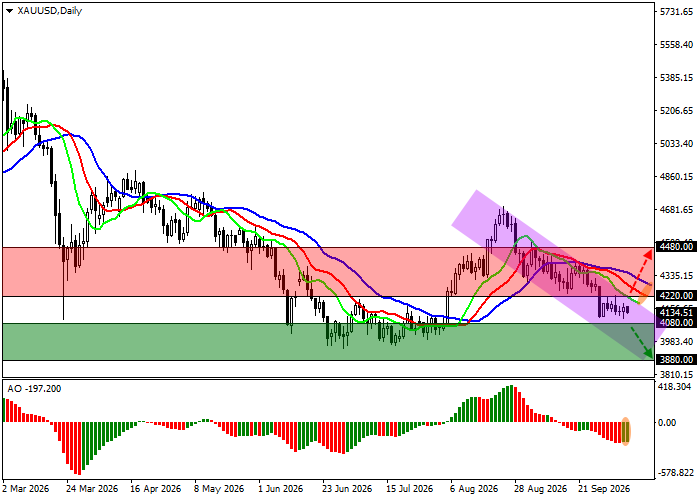
XAU/USD trading scenarios and price forecast
Short positions may be opened after the price declines and consolidates below 4080.0, with a target at 3880.0. Stop-loss — 4180.0. Estimated implementation period: 7 days or more.
Long positions may be opened after the price rises and consolidates above 4220.0, with a target at 4480.0. Stop-loss — 4130.0.
Scenario
| Timeframe | Weekly |
| Recommendation | SELL STOP |
| Entry point | 4080.0 |
| Take Profit | 3880.0 |
| Stop Loss | 4180.0 |
| Key levels | 3880.0, 4080.0, 4220.0, 4480.0 |
Alternative scenario
| Recommendation | BUY STOP |
| Entry point | 4220.0 |
| Take Profit | 4480.0 |
| Stop Loss | 4130.0 |
| Key levels | 3880.0, 4080.0, 4220.0, 4480.0 |
