

Market participants continue to assess the inflationary impact of the rapid development of artificial intelligence technologies. According to Jonathan Kearns, a former Reserve Bank of Australia (RBA) official, large-scale investment in data centres may contribute to additional price pressures. While around three-quarters of this spending is directed toward imported equipment, the remaining domestic component still adds to aggregate demand, making the timing and scale of the inflationary impact difficult to estimate. This increases uncertainty for the Australian economic outlook. In addition, RBA Governor Michele Bullock also highlighted this factor during the previous policy meeting, noting that AI-related demand could begin to feed more visibly into inflation by the end of the year, potentially requiring further policy action after the cash rate was already raised to a fifteen-year high of 4.60%.
The US dollar, which remains the main driver of the pair, is holding near 102.20 on the USDX, supported by elevated Treasury yields and broader monetary policy expectations, while rising geopolitical tensions in the Persian Gulf have pushed oil prices sharply higher, with Brent crude moving above 104.00 intraday. At the same time, initial jobless claims in the United States fell to 197.0K, the lowest level since mid-summer, underscoring ongoing labour market resilience. Nevertheless, according to CME FedWatch, the probability of additional Federal Reserve tightening in October remains relatively low, near 17–18%, compared with higher levels seen last week, as investors continue to expect a pause in the near term while keeping a close watch on December policy expectations.
As noted in our previous AUD/USD forecast, the pair remains under pressure in the medium term, even though the Australian dollar continues to receive some support from the RBA’s hawkish tone and domestic inflation concerns.
Support and resistance levels
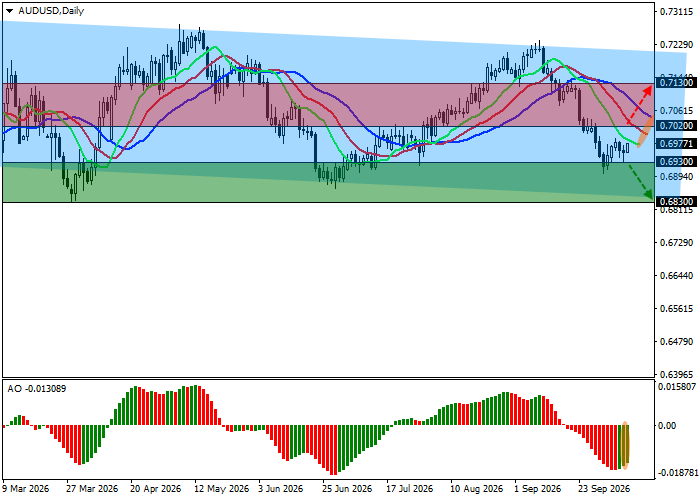
On the daily chart, the trading instrument is correcting above the support line of a descending channel with dynamic boundaries of 0.7200–0.6850.
Technical indicators are strengthening the sell signal: the fast EMAs of the Alligator indicator are directed downward and continue to widen their distance from the slow EMAs, while the AO histogram is forming corrective bars below the zero line.
Support levels: 0.6930, 0.6830.
Resistance levels: 0.7020, 0.7130.
Trading scenarios and AUD/USD forecast
Short positions may be opened after the price declines and consolidates below 0.6930 with a target at 0.6830. Stop-loss — 0.7000. Implementation period: 7 days or more.
Long positions may be opened after the price rises and consolidates above 0.7020 with a target at 0.7130. Stop-loss — 0.6930.
Scenario
| Timeframe | Weekly |
| Recommendation | SELL STOP |
| Entry point | 0.6930 |
| Take Profit | 0.6830 |
| Stop Loss | 0.7000 |
| Key levels | 0.6830, 0.6930, 0.7020, 0.7130 |
Alternative scenario
| Recommendation | BUY STOP |
| Entry point | 0.7020 |
| Take Profit | 0.7130 |
| Stop Loss | 0.6930 |
| Key levels | 0.6830, 0.6930, 0.7020, 0.7130 |
