

Meanwhile, Australia’s trade balance rose sharply in April to 1.79 billion Australian dollars, well above the revised March deficit of –1.02 billion Australian dollars and forecasts of 1.23 billion Australian dollars. The improvement came amid an increase in exports from –2.7% to 7.2%, the strongest monthly growth over the past year. This dynamic was driven by supplies from agricultural regions, with metal ores and minerals accounting for 18.5% and coal for 15.2%. Imports, meanwhile, slowed from 14.1% to 0.8%, with fuel and lubricants making up the largest share at 41.4%, as the developing energy crisis has significantly increased the cost of petroleum products. Thus, strong exports helped the economy soften the impact of slowing activity, although maintaining such figures in the future will be difficult.
The U.S. dollar, which remains the main driver of price movement, reached 99.30 in the USDX amid fundamental and geopolitical factors, primarily due to rising tensions in the Middle East. The escalation of the conflict around the Strait of Hormuz and mutual attacks between Iran and regional countries traditionally lead to a higher risk premium. Reports of damage to transport infrastructure in Kuwait, including airport facilities, and civilian injuries have increased investor concerns, as they affect expectations for hydrocarbon supplies through the waterway, which accounted for up to 20.0% of global oil and petroleum product traffic before the start of the confrontation. Against this background, Brent Crude Oil quotes are reacting with growth, as the market prices in a risk premium of around 5.0–10.0 dollars per barrel, lifting prices to the 85.00–95.00 range, and in more stressful scenarios — above 100.00. Additional pressure comes from the suspension of peace talks following the Israeli army’s offensive in Lebanon, increasing insurance and logistics costs by 20.0–40.0%, while freight rates rise by 10.0–25.0% during escalation periods.
Meanwhile, traders are assessing U.S. macroeconomic statistics: according to the May Challenger layoffs report, the figure increased from 83.387K to 97.006K, representing a 3.4% year-on-year rise.
Support and resistance levels
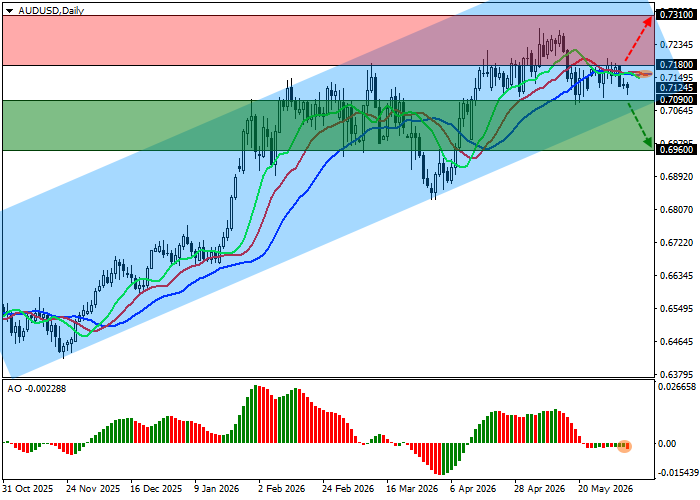
On the daily chart, the trading instrument is located above the support line of the ascending channel with dynamic boundaries at 0.7400–0.7100.
Technical indicators are ready to strengthen the sell signal: the fast EMAs of the Alligator indicator are directed downward and have approached the signal line, while the AO histogram has formed new bars in the negative zone.
Resistance levels: 0.7180, 0.7310.
Support levels: 0.7090, 0.6960.
AUD/USD trading scenarios and forecast
Short positions may be opened after the price declines and consolidates below 0.7090, with a target at 0.6960. Stop-loss — 0.7160. Expected timeframe: 7 days or more. Long positions may be opened after the price rises and consolidates above 0.7180, with a target at 0.7310. Stop-loss — 0.7110.
Scenario
| Timeframe | Weekly |
| Recommendation | SELL STOP |
| Entry point | 0.7085 |
| Take Profit | 0.6960 |
| Stop Loss | 0.7160 |
| Key levels | 0.6960, 0.7090, 0.7180, 0.7310 |
Alternative scenario
| Recommendation | BUY STOP |
| Entry point | 0.7185 |
| Take Profit | 0.7310 |
| Stop Loss | 0.7110 |
| Key levels | 0.6960, 0.7090, 0.7180, 0.7310 |
