
Democrats won majorities in both chambers of the incoming US Congress, setting up divided government when the new lawmakers take office in January. Investors are weighing whether the incoming majority will press the Trump administration to pursue a diplomatic resolution with Iran and challenge some of its tariffs. Oil prices fell as traders reassessed the risk of further military escalation. If that decline persists, lower energy costs could ease inflation pressure and reduce the case for more aggressive Federal Reserve tightening.
US business activity grew more slowly than initially estimated in October. The final S&P Global services PMI fell from 58.8 to 56.1, below the preliminary reading of 57.9, while the composite PMI dropped from 58.4 to 55.9, below its initial estimate of 57.6. Both readings still indicate expansion, and service providers raised their selling prices at a faster pace. The combination leaves the Fed weighing softer growth against continued price pressure.
In the eurozone, annual headline inflation rose from 3.8% in September to 4.0% in October as energy and food inflation accelerated. Energy prices were up 20.8% year on year, while core inflation, which excludes energy, food, alcohol and tobacco, held at 2.5%, according to Eurostat's October flash estimate.
Headline inflation is running at twice the ECB's 2.0% target. That keeps a December rate hike in focus after Bundesbank President Joachim Nagel signalled that further tightening was likely to be needed, as discussed in our previous EUR/USD forecast. Reuters reported on November 4 that markets were pricing in two to three ECB rate increases over the following 12 months.
Slower eurozone growth complicates that outlook. The final October services PMI fell from 53.0 to 51.4, below the flash reading of 51.7. The composite PMI slipped from 53.1 to 51.7, compared with the preliminary estimate of 51.9. The surveys point to continued expansion at the weakest pace in four months, giving the ECB a reason to reassess how much tightening may be needed after December.
Support and Resistance Levels
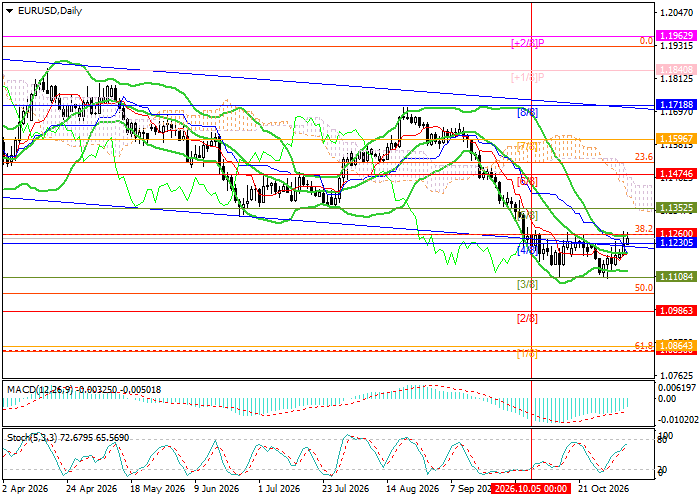
EUR/USD is attempting to move back into its long-term descending channel. A sustained move above the upper Bollinger Band near 1.1260 (38.2% Fibonacci retracement) would support the recovery. The long setup uses 1.1300 as its entry trigger, with targets at 1.1474 (Murrey Math [6/8]), 1.1596 ([7/8]) and 1.1718 ([8/8], the upper boundary of the descending channel).
A break below 1.1108 (Murrey Math [3/8]) could expose 1.0986 (Murrey Math [2/8] on the weekly chart) and 1.0850 (61.8% Fibonacci retracement).
Technical indicators are mixed. The Bollinger Bands are flattening after turning lower, and the negative MACD histogram bars are shrinking. The Stochastic oscillator is approaching overbought territory, where it could turn lower.
Resistance levels: 1.1260, 1.1474, 1.1596, 1.1718.
Support levels: 1.1108, 1.0986, 1.0850.
EUR/USD Trading Scenarios and Exchange Rate Forecast
A break below 1.1108 could support a short position targeting 1.0986 and 1.0850, with a stop-loss at 1.1190. The estimated holding period is 5–7 days.
A move through 1.1300 could support a long position targeting 1.1474, 1.1596 and 1.1718, with a stop-loss at 1.1220.
Scenario
| Timeframe | Weekly |
| Recommendation | SELL STOP |
| Entry Point | 1.1108 |
| Take Profit | 1.0986, 1.0850 |
| Stop Loss | 1.1190 |
| Key Levels | 1.0850, 1.0986, 1.1108, 1.1260, 1.1474, 1.1596, 1.1718 |
Alternative Scenario
| Recommendation | BUY STOP |
| Entry Point | 1.1300 |
| Take Profit | 1.1474, 1.1596, 1.1718 |
| Stop Loss | 1.1220 |
| Key Levels | 1.0850, 1.0986, 1.1108, 1.1260, 1.1474, 1.1596, 1.1718 |
