

Analysts expect Bank Rate to rise from 3.75% to 4.00%, which would mark the first increase since August 2023. Persistent inflation supports the case for tightening: annual headline CPI reached 3.5% in September, while core inflation stood at 2.8%, both above the Bank’s 2.0% target. Economic activity has also continued to expand, with August GDP 2.1% higher than a year earlier, although monthly growth slowed to 0.1%. Labour Force Survey estimates showed unemployment at 4.7% in June–August and employment up by 102.0K over the quarter, while payroll-based measures presented a softer picture. Energy-related inflation risks remain an important consideration. Investors will therefore focus on the Bank’s forecasts and guidance for indications of whether any increase would begin a sustained tightening cycle.
The US dollar, meanwhile, has come under pressure as investors assess the November 3 congressional elections. AP reported that Democrats had won control of both chambers, setting up a divided government under Republican President Donald Trump. This could complicate negotiations over legislation and fiscal policy, while the implications for US policy toward Iran remain uncertain. A reduction in geopolitical tensions could ease energy-related inflation risks, but the timing and scale of any effect would depend on subsequent developments. US labour-market data provided a counterweight to dollar weakness: the September JOLTS report, released on November 3, showed job openings at 7.523 million, compared with a revised 7.190 million in August. However, the Bureau of Labor Statistics described vacancies as little changed, while layoffs and discharges were approximately 1.6 million. These figures leave the Federal Reserve’s next decision dependent on the broader economic picture. The influence of US data on sterling was also discussed in our previous GBP/USD forecast.
Support and Resistance Levels
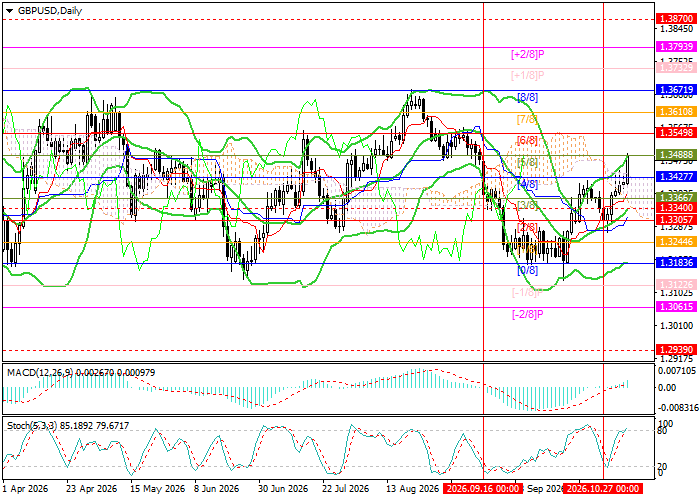
In the supplied technical setup, the pair remains within the broad sideways range of 1.3183–1.3671 (Murrey Math [0/8]–[8/8]) and is attempting to consolidate above 1.3488 (Murrey Math [5/8]). A sustained move above this level could open the way toward 1.3671 (Murrey Math [8/8]) and 1.3793 (Murrey Math [+2/8]). Conversely, a break below the middle Bollinger Band at 1.3340 could trigger a decline toward 1.3183 (Murrey Math [0/8]), 1.3061 (Murrey Math [–2/8]) and 1.2939 (Murrey Math [2/8], W1).
Technical indicators maintain a buy signal: Bollinger Bands are turning upward, while the MACD histogram is expanding in positive territory, although its bars remain small. The Stochastic oscillator has reached the overbought zone, leaving room for a reversal and a limited corrective pullback.
Resistance levels: 1.3488, 1.3671, 1.3793.
Support levels: 1.3340, 1.3183, 1.3061, 1.2939.
GBP/USD Trading Scenarios and Exchange Rate Forecast
Long positions may be opened above 1.3520, with targets at 1.3671 and 1.3793 and a stop-loss at 1.3430. Estimated holding period: 5–7 days. Short positions may be opened below 1.3340, with targets at 1.3183, 1.3061 and 1.2939 and a stop-loss at 1.3420.
Scenario
| Timeframe | Weekly |
| Recommendation | BUY STOP |
| Entry Point | 1.3520 |
| Take Profit | 1.3671, 1.3793 |
| Stop Loss | 1.3430 |
| Key Levels | 1.2939, 1.3061, 1.3183, 1.3340, 1.3488, 1.3671, 1.3793 |
Alternative Scenario
| Recommendation | SELL STOP |
| Entry Point | 1.3340 |
| Take Profit | 1.3183, 1.3061, 1.2939 |
| Stop Loss | 1.3420 |
| Key Levels | 1.2939, 1.3061, 1.3183, 1.3340, 1.3488, 1.3671, 1.3793 |
