
Over the weekend, Bank of Canada Governor Tiff Macklem said he expects the quarterly inflation outlook to be revised higher due to persistently elevated oil and petroleum product prices. In his view, inflation risks have increased amid rising geopolitical tensions in the Persian Gulf, tighter supply conditions and damage to processing infrastructure, and the regulator will make every effort to return price pressures to the 2.0% target. These comments suggest that officials may begin discussing another rate increase as early as this month, although most market participants still expect any policy adjustment to come later rather than immediately. Monday’s September inflation data generally confirmed economists’ expectations: the consumer price index rose from 3.0% to 3.1% year-on-year, while the core measure excluding gasoline slowed from 2.4% to 2.2%. Similar themes affecting the pair were also discussed in our previous USD/CAD forecast.
At the same time, the current decline in the instrument does not yet look fully sustainable, since the US Federal Reserve may still maintain a restrictive monetary stance in the near term. Analysts note that the sharp rise in inflation amid the energy crisis — with the September consumer price index at 3.7% and the producer price index at 6.3% — keeps the possibility of further policy tightening on the table, especially against the backdrop of risks of broader military escalation in the Middle East. Some market participants continue to allow for a more hawkish tone from the regulator if inflation expectations deteriorate further.
Overall, a resumption of growth in USD/CAD is still expected in the medium term.
Support and resistance levels
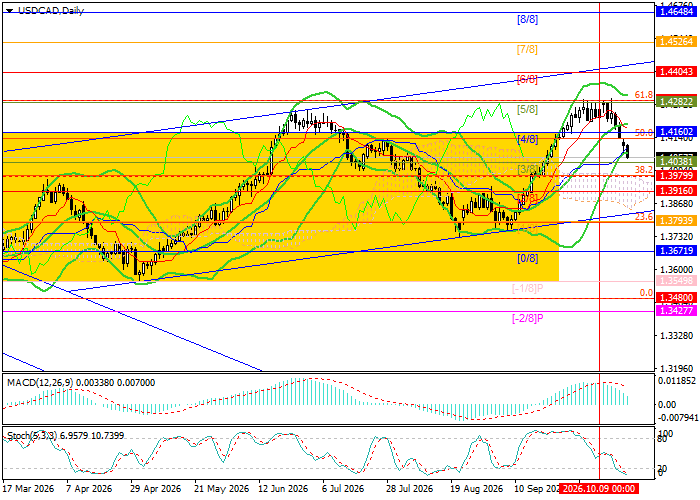
The trading instrument is forming an ascending channel, having reached five-week lows near 1.4050. If the price breaks below 1.4038 (Murray level [3/8]), the decline may continue toward 1.3916 (Murray level [2/8]), although its downside potential appears limited. A renewed move above 1.4160 (Murray level [4/8]) below the middle Bollinger Band would open the way to 1.4282 (Murray level [5/8], 61.8% Fibonacci retracement), 1.4404 (Murray level [6/8]) and 1.4526 (Murray level [7/8], the upper boundary of the ascending channel).
Technical indicators maintain a buy signal: the Bollinger Bands are directed upward, the price has moved beyond the lower band, the Stochastic oscillator has entered oversold territory and may reverse upward, while the MACD histogram is declining but remains in positive territory.
Resistance levels: 1.4160, 1.4282, 1.4404, 1.4526.
Support levels: 1.4038, 1.3916.
Trading Scenarios and USD/CAD Forecast
Long positions may be opened above 1.4160 or on a price reversal near 1.3916, with targets at 1.4282, 1.4404 and 1.4526, and stop-losses near 1.4080 and 1.3840, respectively. Estimated implementation period: 5–7 days.
Scenario
| Timeframe | Weekly |
| Recommendation | BUY STOP |
| Entry Point | 1.4160 |
| Take Profit | 1.4282, 1.4404, 1.4526 |
| Stop Loss | 1.4080 |
| Key Levels | 1.3916, 1.4038, 1.4160, 1.4282, 1.4404, 1.4526 |
Alternative Scenario
| Recommendation | BUY LIMIT |
| Entry Point | 1.3916 |
| Take Profit | 1.4282, 1.4404, 1.4526 |
| Stop Loss | 1.3840 |
| Key Levels | 1.3916, 1.4038, 1.4160, 1.4282, 1.4404, 1.4526 |
