
The second round of direct talks between the United States and Iran, scheduled for April 22, effectively did not take place after the authorities of the Islamic republic, through an intermediary channel represented by Pakistan’s Chief of Army Staff, Field Marshal Asim Munir, informed the White House of their final refusal to participate in the meeting. Tehran linked the decision to the continued restrictions on port infrastructure, which it views as a form of coercive economic isolation and a violation of earlier understandings. Additional instability came from the absence of the US delegation from the talks, including the cancellation of Vice President J.D. Vance’s trip to Pakistan, which was interpreted as a sign of reduced diplomatic engagement in the current round of consultations. At the same time, President Donald Trump announced an extension of the ceasefire for an indefinite period at the request of mediators, although media reports continue to suggest that it may in practice last only 3–5 days, after which both sides could return to mutual attacks. Meanwhile, the Pentagon said that a full demining of the Strait of Hormuz could take up to six months and would not begin before the conflict ends. According to The Washington Post, citing its own sources, this assessment was presented by a Defense Department official during a closed briefing for members of the House Armed Services Committee in Congress. The estimate reportedly triggered a negative reaction from both Democratic and Republican lawmakers, as it implies that high energy prices could persist for a long period even if a peace agreement is eventually reached.
The US currency also received additional support this week from macroeconomic releases, which further affected expectations regarding potential Federal Reserve rate cuts. The March retail sales report showed a three-year record increase of 1.7%, significantly beating forecasts and restoring confidence in the resilience of the economy. Although the main driver was a sharp 15.5% rise in gasoline prices, sales still increased by 0.6% excluding that component, pointing to continued strength in consumer demand supported by tax refunds. Consumer inflation accelerated to 3.3% year-on-year in March, the fastest pace since 2024, while final producer inflation data showed a 4.0% annual increase, the highest level in three years. Against this backdrop, according to the CME FedWatch Tool, the probability that borrowing costs will remain in the 3.50–3.75% range at the April 28–29 meeting stands at a record-high 99.5%.
Against this backdrop, macroeconomic statistics from Switzerland released in recent days have moved into the background for traders. According to the latest quarterly bulletin from the Swiss National Bank, published on April 14, the regulator still expects GDP growth of 1.0% this year and 1.5% in 2027. In the first quarter, according to surveys of company management, the national economy expanded at a solid pace, while inflation remains extremely low, rising only to 0.1% in February. In its quarterly bulletin, the monetary authorities also reaffirmed their readiness to intervene, explicitly stating that “in connection with the conflict in the Middle East, the central bank’s willingness to intervene in the foreign exchange market has increased significantly.”
Support and resistance levels
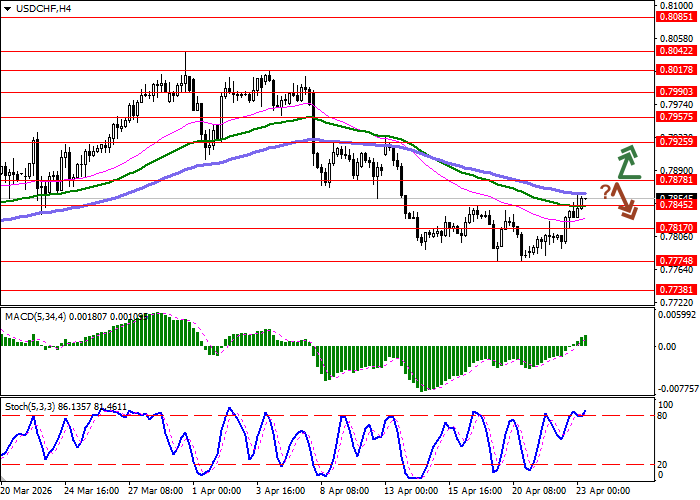
On the daily chart, Bollinger Bands continue to show confident downward movement, while the trading range is narrowing, reflecting mixed price action in the ultra-short term. MACD is turning upward, forming a fresh buy signal and attempting to закрепиться above the signal line. Stochastic is rising more actively and is now rapidly approaching its highs, pointing to growing risks of US dollar overbought conditions in the near term.
Resistance levels: 0.7878, 0.7925, 0.7957, 0.7990.
Support levels: 0.7845, 0.7817, 0.7774, 0.7738.
Trading scenarios and USD/CHF forecast
Long positions may be considered after a confident breakout above 0.7878, with a target at 0.7957. Stop-loss: 0.7845. Implementation period: 2–3 days.
A rebound from 0.7878 as resistance, followed by a breakout below 0.7845, may serve as a signal for short positions with a target at 0.7774. Stop-loss: 0.7878.
Scenario
| Timeframe | Intraday |
| Recommendation | BUY STOP |
| Entry Point | 0.7880 |
| Take Profit | 0.7957 |
| Stop Loss | 0.7845 |
| Key levels | 0.7738, 0.7774, 0.7817, 0.7845, 0.7878, 0.7925, 0.7957, 0.7990 |
Alternative Scenario
| Recommendation | SELL STOP |
| Entry Point | 0.7840 |
| Take Profit | 0.7774 |
| Stop Loss | 0.7878 |
| Key levels | 0.7738, 0.7774, 0.7817, 0.7845, 0.7878, 0.7925, 0.7957, 0.7990 |
