

According to the latest report, the consumer price index rose by 1.4% year-on-year, compared with 1.5% a month earlier, while the core indicator, excluding food and energy prices, fell below 2.0% for the first time in 14 months, declining from 1.9% to 1.6%. Inflation in the Tokyo metropolitan area also corrected from 1.5% to 1.4% year-on-year and from 1.5% to 1.3% in core terms, partly due to fuel subsidies supporting lower energy costs, as well as measures taken by the metropolitan government that sharply reduced water supply charges and made childcare and education services cheaper. Thus, price pressure in one of the country’s most developed economic regions remains below the Bank of Japan’s target. However, experts believe that the consequences of the Middle East crisis, which has already caused a significant correction in energy prices, may become a driver of renewed upward dynamics.
At the same time, the national labor market remains stable: the unemployment rate fell to 2.5% in April from 2.7% a month earlier, significantly exceeding analysts’ expectations, which had assumed the previous reading would remain unchanged. The number of unemployed citizens fell by 70.0K to 1.79 million, reaching its lowest level since July, while employment increased by 610.0K to a record 68.76 million. The labor force rose by 53.0K to an all-time high of 70.55 million. The jobs-to-applicants ratio remained at 1.18, unchanged from March and in line with market expectations. This points to a relatively balanced, though not overheated, labor market. For the Bank of Japan, this combination of factors creates a policy dilemma: inflation settling below 2.0% argues against tightening, but structural distortions caused by household support measures and growth in the technology sector may point to hidden resilience in demand. As a result, the regulator’s upcoming decisions are likely to depend increasingly not on aggregate inflation indicators, but on the quality of their structure and the stability of core price components.
Meanwhile, industrial production rose from –0.4% to 0.8% in April, while retail sales increased from 1.4% to 2.1%. Thus, the actual dynamics not only exceeded expectations but also temporarily eased concerns about a possible slowdown in manufacturing. The fastest growth was recorded in the production of semiconductor inspection equipment, which increased by 44.3%, while shipments of petrochemical feedstock fell by 16.2%, reflecting the continued sensitivity of traditional industries to external price shocks.
At the same time, more U.S. Federal Reserve officials are leaning toward hawkish rhetoric. Kansas City Fed President Jeffrey Schmid said that inflation remaining above the 2.0% target for too long is the main problem for the U.S. economy and that new measures to contain it should be considered. Fed Vice Chair Michelle Bowman, whose monetary policy views are considered among the softest, noted that the current energy shocks could change her opinion.
Support and resistance levels
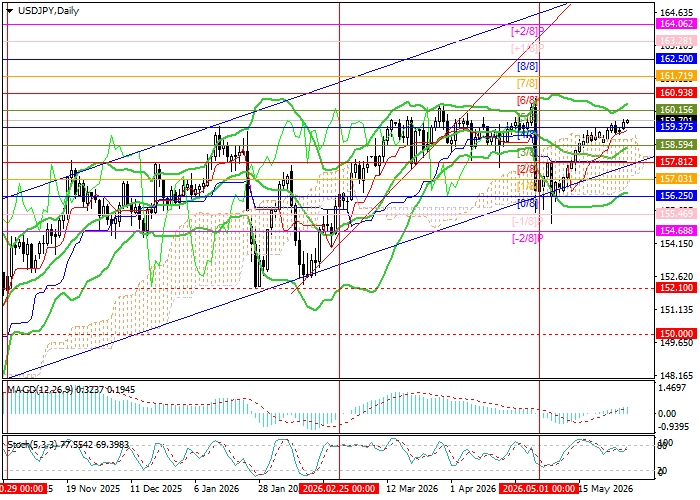
Technically, the instrument remains within a long-term ascending channel: at the beginning of last month, the price reversed from its lower boundary and is now trying to consolidate above 159.37, the Murray level [4/8], in order to continue rising toward 160.93, the Murray level [6/8] and the upper Bollinger Band, 162.50, the Murray level [8/8], and 164.06, the Murray level [+2/8]. The 157.81 mark, the Murray level [2/8], is key for the bears: a breakout below it would act as a catalyst for an exit from the ascending channel, a change in the current trend, and a stronger move toward 156.25, the Murray level [0/8], and 154.68, the Murray level [–2/8].
Technical indicators allow for continued growth: Bollinger Bands are turning upward, the MACD histogram is increasing in the positive zone, while Stochastic is close to the overbought area, which does not exclude a near-term reversal and correction, although its potential appears limited.
Resistance levels: 159.37, 160.93, 162.50, 164.06.
Support levels: 157.81, 156.25, 154.68.
USD/JPY trading scenarios and forecast
Long positions may be opened from 159.80, with targets at 160.93, 162.50, and 164.06 and a stop-loss at 159.10. Expected timeframe: 5–7 days.
Short positions may be opened below 157.81, with targets at 156.25 and 154.68 and a stop-loss at 158.80.
Scenario
| Timeframe | Weekly |
| Recommendation | BUY STOP |
| Entry point | 159.85 |
| Take Profit | 160.93, 162.50, 164.06 |
| Stop Loss | 159.10 |
| Key levels | 154.68, 156.25, 157.81, 159.37, 160.93, 162.50, 164.06 |
Alternative scenario
| Recommendation | SELL STOP |
| Entry point | 157.80 |
| Take Profit | 156.25, 154.68 |
| Stop Loss | 158.80 |
| Key levels | 154.68, 156.25, 157.81, 159.37, 160.93, 162.50, 164.06 |
