

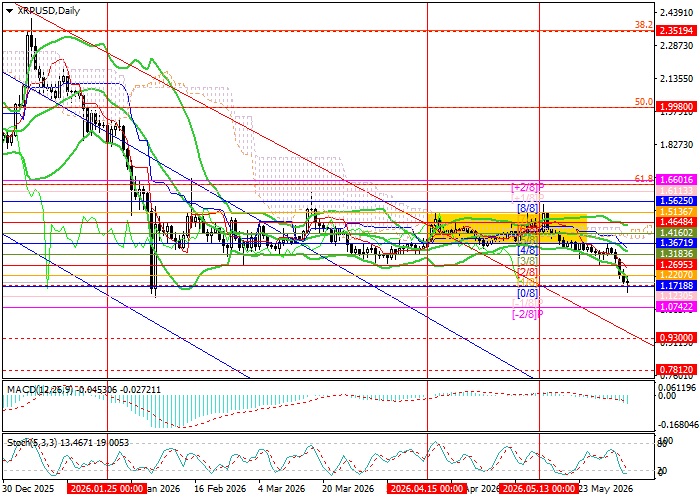
Technical indicators allow for the continuation of the current dynamics: Bollinger Bands are turning downward, the MACD histogram is increasing in the negative zone, while Stochastic has reached the oversold area, which does not exclude a reversal and correction, although its potential appears limited. It is also worth noting that on the weekly chart, Bollinger Bands are still directed downward, confirming the continuation of the long-term trend. In addition, the price has likely completed a flag pattern within the downtrend, which is another signal for a stronger bearish impulse.
Support and resistance levels
Resistance levels: 1.3671, 1.5136, 1.6600.
Support levels: 1.1718, 1.0742, 0.9300, 0.7812.
XRP/USD trading scenarios and forecast
Short positions may be opened below 1.1718, with targets at 1.0742, 0.9300, and 0.7812 and a stop-loss at 1.2430. Expected timeframe: 5–7 days.
Long positions may be opened above 1.3671, with targets at 1.5136 and 1.6600 and a stop-loss at 1.2720.
Scenario
| Timeframe | Weekly |
| Recommendation | SELL STOP |
| Entry point | 1.1715 |
| Take Profit | 1.0742, 0.9300, 0.7812 |
| Stop Loss | 1.2430 |
| Key levels | 0.7812, 0.9300, 1.0742, 1.1718, 1.3671, 1.5136, 1.6600 |
Alternative scenario
| Recommendation | BUY STOP |
| Entry point | 1.3675 |
| Take Profit | 1.5136, 1.6600 |
| Stop Loss | 1.2720 |
| Key levels | 0.7812, 0.9300, 1.0742, 1.1718, 1.3671, 1.5136, 1.6600 |
