

Over the weekend, traders closely followed the rhetoric of participants in the U.S.–Iran conflict. On Friday, both sides actively hinted at signing a 60-day ceasefire to coordinate issues related to Iran’s nuclear program. However, instead of reaching an agreement, the opponents continued attacking each other’s military facilities, while U.S. President Donald Trump, in an interview with Fox News, confirmed that he was in no hurry to conclude a peace deal and threatened to expand military action if no agreement was reached. As a result, the Strait of Hormuz remains blocked, pressure on the global economy is increasing, and demand for the dollar as a safe-haven asset is rising.
Another driver of the negative movement in the cryptocurrency sector is the strengthening expectation of tighter monetary policy from the U.S. Federal Reserve due to high inflation in the country. In April, the Personal Consumption Expenditures price index reached 3.8%, while the core indicator stood at 3.3%, significantly above the regulator’s 2.0% target. Thus, the national economy remains resilient despite a substantial increase in price pressure, and officials may shift toward a more hawkish rhetoric early next year. Against this background, investors are actively reducing exposure to crypto assets, which was reflected in a significant decline in the balance of digital exchange-traded funds. Last week, outflows from Bitcoin ETFs amounted to 1.415 billion dollars, while the total outflow has now continued for ten consecutive days, the longest period since the beginning of last year, during which ETFs collectively lost 2.97 billion dollars. Nevertheless, the Fear and Greed Index rose into the “fear” zone at 29.
Overall, the fundamental conditions for further decline in BTC/USD remain in place.
Support and resistance levels
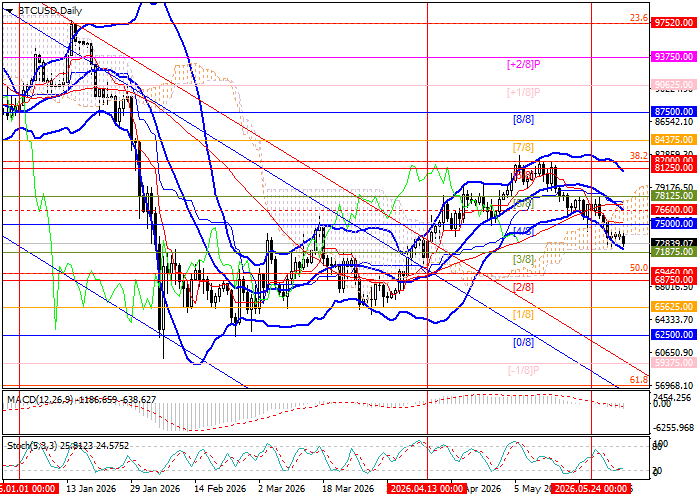
The trading instrument is forming a short-term downtrend, approaching 71875.00, the Murray level [3/8]. A breakout below this mark would allow the price to reach the targets of 68750.00, the Murray level [2/8], and 65625.00, the Murray level [1/8]. If the price breaks above the middle line of the Bollinger Bands at 76600.00, growth toward 82000.00, the 38.2% Fibonacci retracement, and 87500.00, the Murray level [8/8], is expected.
Technical indicators maintain a sell signal: Bollinger Bands are turning downward, the MACD histogram is increasing in the negative zone, and Stochastic is moving horizontally near the oversold area.
Resistance levels: 76600.00, 82000.00, 87500.00.
Support levels: 71875.00, 68750.00, 65625.00.
BTC/USD trading scenarios and forecast
Short positions may be opened below 71875.00, with targets at 68750.00 and 65625.00 and a stop-loss at 74000.00. Expected timeframe: 5–7 days.
Long positions may be opened above 76600.00, with targets at 82000.00 and 87500.00 and a stop-loss at 73800.00.
Scenario
| Timeframe | Weekly |
| Recommendation | SELL STOP |
| Entry point | 71850.00 |
| Take Profit | 68750.00, 65625.00 |
| Stop Loss | 74000.00 |
| Key levels | 65625.00, 68750.00, 71875.00, 76600.00, 82000.00, 87500.00 |
Alternative scenario
| Recommendation | BUY STOP |
| Entry point | 76620.00 |
| Take Profit | 82000.00, 87500.00 |
| Stop Loss | 73800.00 |
| Key levels | 65625.00, 68750.00, 71875.00, 76600.00, 82000.00, 87500.00 |
