

Investors remain disappointed by the suspension of negotiations aimed at resolving the U.S.–Iran conflict. Over the weekend, both sides resumed mutual attacks, which could develop into another round of military confrontation. In addition, Tehran announced a full blockade of the Strait of Hormuz and the suspension of diplomatic contacts with the White House, after which U.S. President Donald Trump and Secretary of State Marco Rubio signaled to the markets that consultations would continue.
Additional pressure on the asset comes from the increased likelihood of tighter monetary policy from the U.S. Federal Reserve by the end of the year amid rising inflation. In April, the consumer price index rose from 3.3% to 3.8%, reaching a three-year high, the producer price index increased from 4.3% to 6.0%, and the Personal Consumption Expenditures indicator reached 3.8%. At the same time, the labor market remains stable. This situation is reducing investor interest in risk assets: according to CoinGlass, nearly 1.84 billion dollars in leveraged cryptocurrency positions were liquidated over the past 24 hours, the highest level since early February. The largest capital outflows were recorded in BTC at 883.66 million dollars, ETH at 475.73 million dollars, and SOL at 91.18 million dollars.
Sentiment in the sector remains negative, as evidenced by continued investment outflows from cryptocurrency exchange-traded products. However, Solana ETFs saw inflows of 55.1 million dollars, as some market participants are diversifying risks by shifting capital into altcoins. The Fear and Greed Index has reached a three-month low at 11.
Support and resistance levels
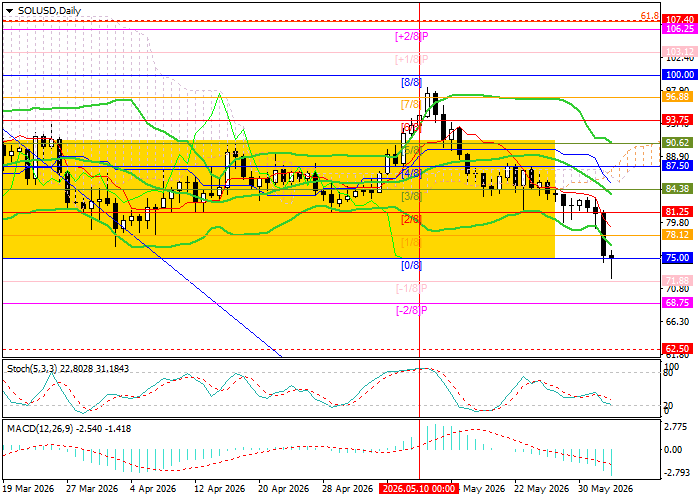
The trading instrument is moving within a medium-term sideways range of 91.00–75.00, testing its lower boundary. Consolidation below this level would allow the price to reach the targets of 68.75, the Murray level [–2/8], and 62.50, the Murray level [2/8] on W1. If the price breaks above the middle line of the Bollinger Bands at 84.38, the Murray level [3/8], growth may resume toward 93.75, the Murray level [6/8], 100.00, the Murray level [8/8], and 107.40, the 61.8% Fibonacci retracement.
Technical indicators maintain a sell signal: Bollinger Bands are turning downward, the MACD histogram has moved into the negative zone, and Stochastic is close to the oversold area, which does not exclude a limited correction. In addition, on the weekly chart, Bollinger Bands are directed downward, confirming the continuation of the long-term downtrend.
Resistance levels: 84.38, 93.75, 100.00, 107.40.
Support levels: 75.00, 68.75, 62.50.
SOL/USD trading scenarios and forecast
Short positions may be opened below 75.00, with targets at 68.75 and 62.50 and a stop-loss at 79.00. Expected timeframe: 5–7 days. Long positions may be opened above 84.38, with targets at 93.75, 100.00, and 107.40 and a stop-loss at 80.00.
Scenario
| Timeframe | Weekly |
| Recommendation | SELL |
| Entry point | 75.22 |
| Take Profit | 68.75, 62.50 |
| Stop Loss | 79.00 |
| Key levels | 62.50, 68.75, 75.00, 84.38, 93.75, 100.00, 107.40 |
Alternative scenario
| Recommendation | BUY STOP |
| Entry point | 84.45 |
| Take Profit | 93.75, 100.00, 107.40 |
| Stop Loss | 80.00 |
| Key levels | 62.50, 68.75, 75.00, 84.38, 93.75, 100.00, 107.40 |
