

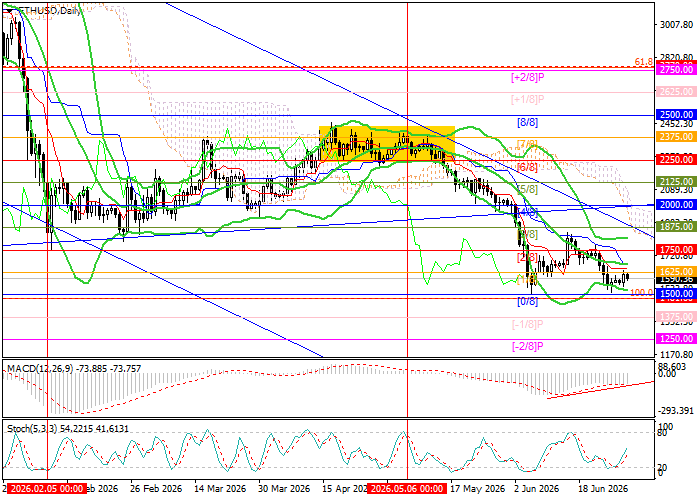
Technical indicators do not provide a unified signal. Bollinger Bands are turning downward, while the Stochastic oscillator is moving higher from oversold territory. At the same time, the MACD histogram remains stable in negative territory but is forming a bullish divergence. It should also be noted that Bollinger Bands on the weekly chart are still pointing downward, indicating that the broader bearish trend is likely to remain relevant in the near term, although the possibility of a correction cannot be ruled out.
Support and Resistance Levels
Resistance levels: 1,750.00, 2,000.00, 2,250.00, 2,500.00.
Support levels: 1,500.00, 1,250.00.
ETH/USD Trading Scenarios and Price Forecast
Short positions may be considered below 1,500.00 or after a price reversal near 1,750.00, with a target at 1,250.00 and stop-losses at 1,680.00 and 1,880.00, respectively. Expected implementation period: 5–7 days.
Scenario
| Timeframe | Weekly |
| Recommendation | SELL STOP |
| Entry Point | 1490.00 |
| Take Profit | 1250.00 |
| Stop Loss | 1680.00 |
| Key Levels | 1250.00, 1500.00, 1750.00, 2000.00, 2250.00, 2500.00 |
Alternative Scenario
| Recommendation | SELL LIMIT |
| Entry Point | 1750.00 |
| Take Profit | 1250.00 |
| Stop Loss | 1880.00 |
| Key Levels | 1250.00, 1500.00, 1750.00, 2000.00, 2250.00, 2500.00 |
Conclusion
Ethereum remains under pressure while trading below $1,750, with the broader technical picture still favouring sellers. A confirmed break below $1,500 could accelerate the decline toward $1,250, although oversold conditions and a bullish MACD divergence leave room for a short-term rebound.
