

The personal consumption expenditures price index, which the regulator closely monitors, increased from 3.8% to 4.1%, while the core indicator rose from 3.3% to 3.4%, significantly exceeding the 2.0% target. In addition, first-quarter gross domestic product (GDP) expanded by 2.1%, compared with expectations of 1.6%. Stronger inflationary pressure, combined with solid economic growth and a stable labour market — with unemployment remaining at 4.3% for several months and nonfarm payrolls reaching 172,000 — gives officials room to raise borrowing costs, putting pressure on assets that compete with the US dollar.
At present, most market participants expect borrowing costs to rise as early as September, while the most aggressive forecasts suggest a cumulative increase of 75 basis points this year. In addition, easing tensions in the Persian Gulf, which continues despite exchanges of attacks between the United States and Iran, has provided little support to the cryptocurrency sector. According to officials’ statements, the sides agreed again on Sunday to suspend hostilities, allow commercial vessels to pass freely through the Strait of Hormuz, and continue diplomatic negotiations. Despite this, digital assets failed to strengthen significantly, as reflected in a USD 1.787 million decline in the balance of exchange-traded digital funds last week. The Fear and Greed Index remains in the “extreme fear” zone at 12.
Overall, fundamental factors support further downside in BTC/USD over the medium term.
Support and resistance levels
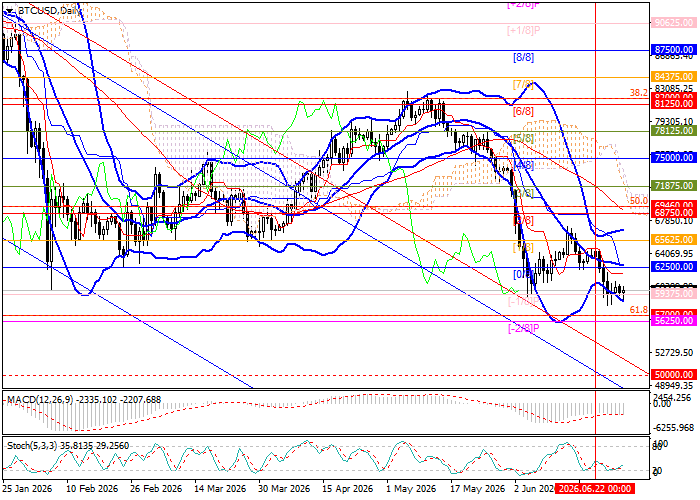
The instrument is moving within a broad market downtrend. The price is currently testing 59,375.00 (Murray level [–1/8]); a downside breakout below this level and 57,000.00 (61.8% Fibonacci retracement) could open the way toward 50,000.00 (Murray level [0/8], W1). Conversely, a consolidation above the upper Bollinger Band at 65,625.00 (Murray level [1/8]) could trigger growth toward 75,000.00 (Murray level [4/8]) and 82,000.00 (38.2% Fibonacci retracement).
Technical indicators maintain a sell signal: Bollinger Bands are directed lower, the MACD histogram remains stable in negative territory, and the Stochastic may turn upward from the oversold zone, leaving room for a limited correction. On the weekly chart, Bollinger Bands are also directed downward, confirming the persistence of the bearish trend.
Resistance levels: 65,625.00, 75,000.00, 82,000.00.
Support levels: 59,375.00, 57,000.00, 50,000.00.
Trading Scenarios and BTC/USD Forecast
Short positions may be opened below 57,000.00, with the target at 50,000.00 and a stop-loss at 61,500.00. Timeframe: 5–7 days. Long positions may be opened above 65,625.00, with targets at 75,000.00 and 82,000.00 and a stop-loss at 60,000.00.
Scenario
| Timeframe | Weekly |
| Recommendation | SELL STOP |
| Entry point | 56,990.00 |
| Take Profit | 50,000.00 |
| Stop Loss | 61,500.00 |
| Key levels | 50,000.00, 57,000.00, 59,375.00, 65,625.00, 75,000.00, 82,000.00 |
Alternative Scenario
| Recommendation | BUY STOP |
| Entry point | 65,700.00 |
| Take Profit | 75,000.00, 82,000.00 |
| Stop Loss | 60,000.00 |
| Key levels | 50,000.00, 57,000.00, 59,375.00, 65,625.00, 75,000.00, 82,000.00 |
