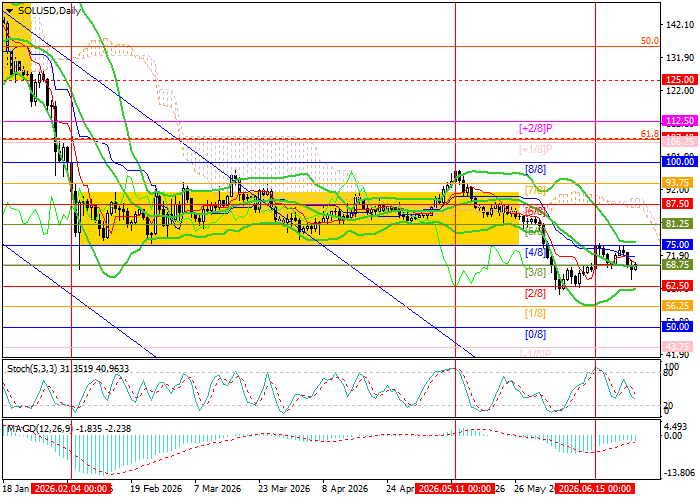
In the middle of the month, SOL/USD resumed its decline within the medium-term downtrend after a correction from 75.00 (Murray level [4/8]). The pair is now testing the middle line of the Bollinger Bands near 68.75 (Murray level [3/8]). A consolidation below this level would allow bears to regain lost ground and continue toward 56.25 (Murray level [1/8]), 50.00 (Murray level [0/8]), and 43.75 (Murray level [–1/8]). The 75.00 mark (Murray level [4/8]), reinforced by the upper Bollinger Band, appears to be key for bulls. A breakout above it would return the price to the long-term sideways range, after which it could move toward 91.00, the upper boundary of the range, or 100.00 (Murray level [8/8]).
Technical indicators do not provide a clear signal: the Bollinger Bands are shifting into a horizontal movement, the MACD histogram remains stable in negative territory, and the Stochastic has turned downward.
Support and resistance levels
Resistance levels: 75.00, 91.00, 100.00.
Support levels: 68.75, 56.25, 50.00, 43.75.
Trading scenarios and SOL/USD forecast
Short positions may be opened below 67.00, with targets at 56.25, 50.00, and 43.75, and a stop-loss at 73.30. Expected implementation period: 5–7 days. Long positions may be opened above 75.00, with targets at 91.00 and 100.00, and a stop-loss at 69.00.
Main scenario
| Timeframe |
Weekly |
| Recommendation |
SELL STOP |
| Entry point |
67.00 |
| Take Profit |
56.25, 50.00, 43.75 |
| Stop Loss |
73.30 |
| Key levels |
43.75, 50.00, 56.25, 68.75, 75.00, 91.00, 100.00 |
Alternative scenario
| Recommendation |
BUY STOP |
| Entry point |
75.10 |
| Take Profit |
91.00, 100.00 |
| Stop Loss |
69.00 |
| Key levels |
43.75, 50.00, 56.25, 68.75, 75.00, 91.00, 100.00 |
John Isige is an experienced cryptocurrency journalist and market analyst specializing in digital assets, blockchain innovation, and emerging Web3 trends. He provides clear, actionable market insights for traders and investors, with particular expertise in DeFi, smart contracts, NFTs, RWAs, and AI-powered blockchain ecosystems. His commentary and analysis have been featured in FORECK.INFO, CoinGape, CryptoNews, and other leading digital finance publications