

Nevertheless, the asset’s current growth does not appear sustainable, as the broader fundamental factors that remain negative for the cryptocurrency market are still in place. Despite slower employment growth, inflation remains well above the Federal Reserve’s 2.0% target, with the Consumer Price Index rising by 4.2% year-on-year in May. This does not rule out another increase in borrowing costs this year. Trader sentiment will depend on the minutes of the regulator’s latest meeting, due on Wednesday at 20:00 (GMT+2), as well as June inflation data.
In addition, investors remain concerned about the possibility of large-scale coin sales by Strategy Inc., one of the largest BTC holders. Its management recently announced the possibility of bringing more than $1.0 billion worth of BTC to the market, which could place significant pressure on “digital gold” and the wider sector. Experts are also closely monitoring the progress of the CLARITY Act, with key hearings in the House of Representatives expected to begin on July 17. The bill currently faces strong opposition from both politicians and public-interest organisations: some lawmakers are dissatisfied with the absence of direct restrictions on government officials profiting from crypto-related activities, while advocacy groups fear that the document does not provide sufficient protection for investors against fraud.
Under these conditions, overall sentiment in the cryptocurrency sector remains negative. Over the past four sessions, Bitcoin ETF holdings have declined by $526.1 million, while the Fear and Greed Index, although rising to 24 points, has remained in the “extreme fear” zone.
Support and resistance levels
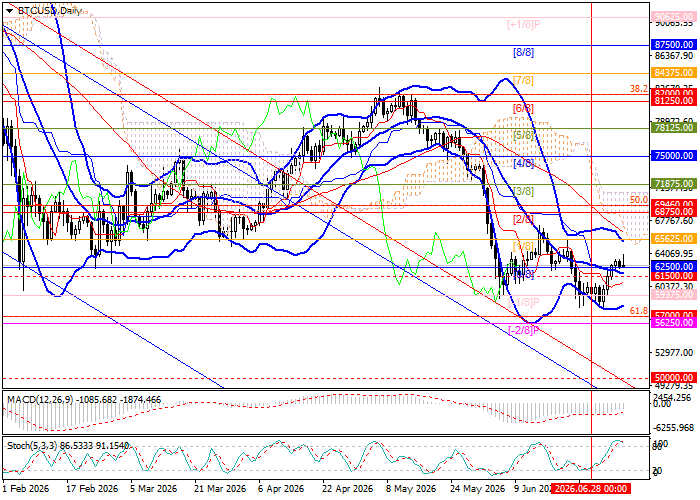
The trading instrument has consolidated above the 62,500.00 level (Murray level [0/8]). After breaking above the upper Bollinger Band at 65,625.00 (Murray level [1/8]), a trend reversal and renewed growth toward 69,460.00 (50.0% Fibonacci retracement) and 75,000.00 (Murray level [4/8]) may be expected. However, if the pair breaks below the middle Bollinger Band at 61,500.00, negative dynamics are likely to resume toward 57,000.00 (61.8% Fibonacci retracement) and 50,000.00 (Murray level [0/8], W1).
Technical indicators continue to generate a sell signal: the Bollinger Bands are trending downward, the MACD histogram remains stable in negative territory, and the Stochastic oscillator has reached the overbought zone and may turn downward in the near term.
Resistance levels: 65,625.00, 69,460.00, 75,000.00.
Support levels: 61,500.00, 57,000.00, 50,000.00.
BTC/USD Trading Scenarios and Price Forecast
Short positions may be opened below 61,500.00 with targets at 57,000.00 and 50,000.00, with a stop-loss at 64,500.00. Expected implementation period: 5–7 days.
Long positions may be opened above 65,625.00 with targets at 69,460.00 and 75,000.00, with a stop-loss at 62,800.00.
Scenario
| Timeframe | Weekly |
| Recommendation | SELL STOP |
| Entry point | 61499.95 |
| Take Profit | 57000.00, 50000.00 |
| Stop Loss | 64500.00 |
| Key levels | 50000.00, 57000.00, 61500.00, 65625.00, 69460.00, 75000.00 |
Alternative Scenario
| Recommendation | BUY STOP |
| Entry point | 65625.05 |
| Take Profit | 69460.00, 75000.00 |
| Stop Loss | 62800.00 |
| Key levels | 50000.00, 57000.00, 61500.00, 65625.00, 69460.00, 75000.00 |
