

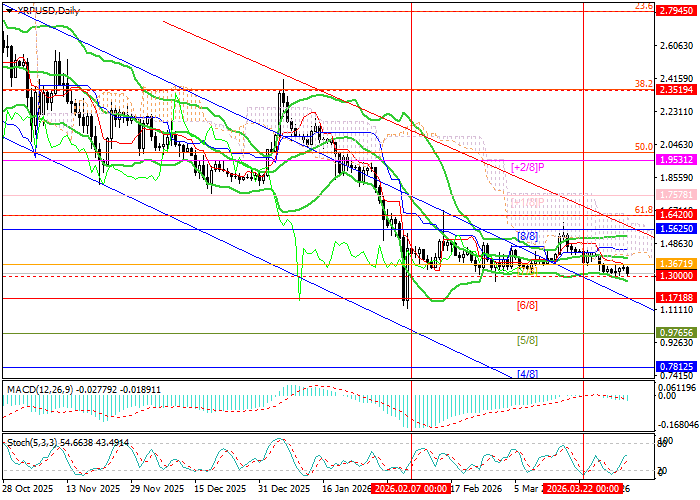
Technical indicators do not provide a unified signal: Bollinger Bands remain horizontal, the MACD histogram is expanding in the negative zone, while the Stochastic oscillator has turned upward from the oversold area, not excluding a return to the sideways range. It is also worth noting that on the weekly chart Bollinger Bands remain directed downward, confirming the continuation of the long-term downtrend. In addition, price action shows signs of forming a flag pattern, indicating a high probability of renewed decline in the medium term.
Support and Resistance Levels
Resistance levels: 1.5625, 1.6420, 1.9531, 2.3437.
Support levels: 1.3000, 0.9765, 0.7812.
Trading Scenarios and XRP/USD Forecast
Short positions should be opened below 1.3000 with targets at 0.9765 and 0.7812, and stop-loss at 1.4900. Implementation period: 5–7 days.
Long positions can be opened above 1.6420 with targets at 1.9531 and 2.3437, and stop-loss at 1.4200.
Scenario
| Timeframe | Weekly |
| Recommendation | SELL STOP |
| Entry Point | 1.2830 |
| Take Profit | 0.9765, 0.7812 |
| Stop Loss | 1.4900 |
| Key Levels | 0.7812, 0.9765, 1.3000, 1.5625, 1.6420, 1.9531, 2.3437 |
Alternative Scenario
| Recommendation | BUY STOP |
| Entry Point | 1.6500 |
| Take Profit | 1.9531, 2.3437 |
| Stop Loss | 1.4200 |
| Key Levels | 0.7812, 0.9765, 1.3000, 1.5625, 1.6420, 1.9531, 2.3437 |
XRP remains under increasing bearish pressure after breaking out of a multi-month range. A break below 1.3000 may accelerate the decline toward lower support levels. At the same time, a recovery above 1.6420 would signal a potential reversal and renewed bullish momentum.
