

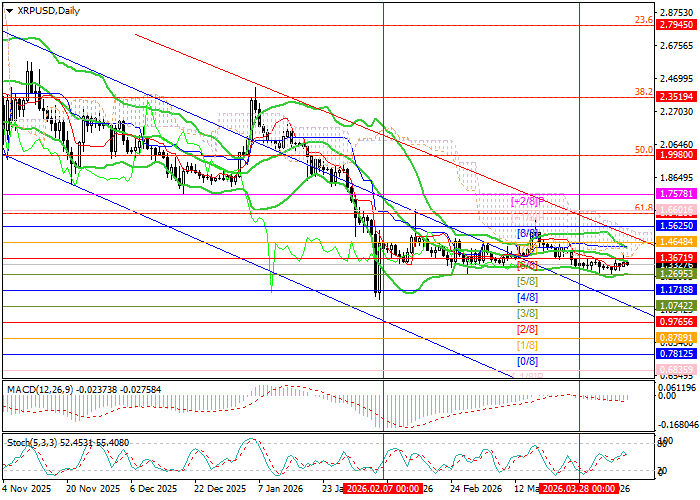
Technical indicators do not provide a unified signal: Bollinger Bands and Stochastic remain flat, while the MACD histogram is stable in negative territory. It is also worth noting that signs of a “flag” pattern have appeared on the weekly chart, pointing to a high probability of stronger bearish momentum in the medium term.
Support and resistance levels
Resistance levels: 1.5625, 1.7578, 1.9980, 2.3519.
Support levels: 1.2695, 1.0742, 0.9765.
Trading scenarios and XRP/USD forecast
Short positions may be considered below 1.2695 with targets at 1.0742 and 0.9765, and a stop-loss at 1.4020. Implementation period: 5-7 days.
Long positions may be considered above 1.5625 with targets at 1.7578, 1.9980, and 2.3519, and a stop-loss at 1.4300.
Scenario
| Timeframe | Weekly |
| Recommendation | SELL STOP |
| Entry Point | 1.2680 |
| Take Profit | 1.0742, 0.9765 |
| Stop Loss | 1.4020 |
| Key Levels | 0.9765, 1.0742, 1.2695, 1.5625, 1.7578, 1.9980, 2.3519 |
Alternative scenario
| Recommendation | BUY STOP |
| Entry Point | 1.5640 |
| Take Profit | 1.7578, 1.9980, 2.3519 |
| Stop Loss | 1.4300 |
| Key Levels | 0.9765, 1.0742, 1.2695, 1.5625, 1.7578, 1.9980, 2.3519 |
XRP/USD is still moving inside a tight range, but the structure is beginning to favor a stronger directional move. The most important trigger on the downside is the 1.2695 level. If that support breaks, bearish momentum could accelerate toward the next major targets.
