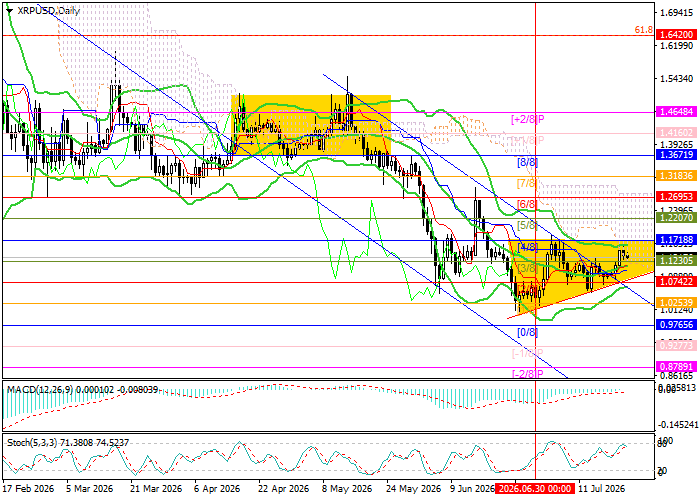
Since the beginning of the month, the XRP/USD pair has been attempting to recover its previous losses and has now approached 1.1718 (Murrey level [4/8]) for the second time, although it has yet to break through this level. The chart configuration resembles an ascending triangle pattern, so a breakout above 1.1718 could signal a shift in the prevailing trend and strengthen bullish momentum toward 1.2695 (Murrey level [6/8]), 1.3671 (Murrey level [8/8]) and 1.4648 (Murrey level [+2/8]). The key level for sellers is 1.0742 (Murrey level [2/8], the lower Bollinger Band). A consolidation below this level would signal a breakout through the lower boundary of the pattern and could lead to tests of 0.9765 (Murrey level [0/8]) and 0.8789 (Murrey level [–2/8]).
Technical indicators do not provide a unified signal. The Bollinger Bands are turning upward, while the MACD histogram is preparing to move into positive territory, although the Stochastic oscillator has already reached the overbought zone. It is also worth noting that the Bollinger Bands on the weekly chart remain directed downward, confirming that the long-term bearish trend is still intact.
Support and Resistance Levels
Resistance levels: 1.1718, 1.2695, 1.3671, 1.4648.
Support levels: 1.0742, 0.9765, 0.8789.
XRP/USD Trading Scenarios and Price Forecast
Short positions may be opened below 1.0742 with targets at 0.9765 and 0.8789 and a stop-loss at 1.1450. Estimated implementation period: 5–7 days.
Long positions may be opened above 1.1718 with targets at 1.2695, 1.3671 and 1.4648 and a stop-loss at 1.1000.
Main Scenario
| Timeframe |
Weekly |
| Recommendation |
SELL STOP |
| Entry Point |
1.0730 |
| Take Profit |
0.9765, 0.8789 |
| Stop Loss |
1.1450 |
| Key Levels |
0.8789, 0.9765, 1.0742, 1.1718, 1.2695, 1.3671, 1.4648 |
Alternative Scenario
| Recommendation |
BUY STOP |
| Entry Point |
1.1730 |
| Take Profit |
1.2695, 1.3671, 1.4648 |
| Stop Loss |
1.1000 |
| Key Levels |
0.8789, 0.9765, 1.0742, 1.1718, 1.2695, 1.3671, 1.4648 |
John Isige is an experienced cryptocurrency journalist and market analyst specializing in digital assets, blockchain innovation, and emerging Web3 trends. He provides clear, actionable market insights for traders and investors, with particular expertise in DeFi, smart contracts, NFTs, RWAs, and AI-powered blockchain ecosystems. His commentary and analysis have been featured in FORECK.INFO, CoinGape, CryptoNews, and other leading digital finance publications