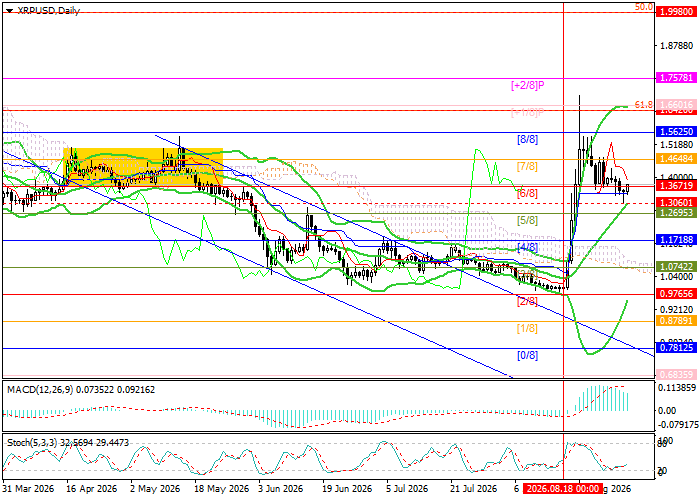
Until mid-August, XRP/USD traded steadily lower within a long-term downtrend. Two weeks ago, the pair staged a strong corrective rebound after the US Treasury announced that it would increase the maximum size of long-end liquidity-support buybacks from $2.0 billion to at least $4.0 billion per operation, effective September 9. The measure is intended to improve Treasury-market liquidity rather than inject capital directly into cryptocurrencies. However, the initial decline in long-term yields supported a broader risk-on move, examined by FORECK.INFO in its recent analysis of the market reaction. XRP/USD reached the 1.6970 area before reversing lower. The pair is now approaching the 1.3060–1.2695 support zone, formed by the middle Bollinger Band and Murrey [5/8] level. A break below 1.2695 could open the way toward 1.1718, the Murrey [4/8] level, followed by 0.9765, the Murrey [2/8] level, and 0.7812, the Murrey [0/8] level. Conversely, consolidation above 1.5625, the Murrey [8/8] level, could support a recovery toward 1.7578, the Murrey [+2/8] level, and 1.9980, the 50.0% Fibonacci retracement.
Technical indicators do not rule out renewed growth. The Bollinger Bands are turning higher, the MACD histogram is contracting in positive territory, while the Stochastic Oscillator has reached the oversold area and may reverse upward. Compared with the bearish setup described in the previous forecast, the daily indicators have improved. On the weekly chart, the Bollinger Bands are still pointing lower, but the price has consolidated above their middle line, leaving open the possibility of a trend reversal.
Support and Resistance Levels
Resistance levels: 1.5625, 1.7578, 1.9980.
Support levels: 1.2695, 1.1718, 0.9765, 0.7812.
XRP/USD Trading Scenarios and Price Forecast
Long positions may be considered above 1.5625, with targets at 1.7578 and 1.9980 and a stop-loss at 1.4300. Time horizon: 5–7 days. Short positions may be considered below 1.2695, with targets at 1.1718, 0.9765 and 0.7812 and a stop-loss at 1.3500.
Scenario
| Timeframe |
Weekly |
| Recommendation |
BUY STOP |
| Entry Point |
1.5625 |
| Take Profit |
1.7578, 1.9980 |
| Stop Loss |
1.4300 |
| Key Levels |
0.7812, 0.9765, 1.1718, 1.2695, 1.5625, 1.7578, 1.9980 |
Alternative Scenario
| Recommendation |
SELL STOP |
| Entry Point |
1.2695 |
| Take Profit |
1.1718, 0.9765, 0.7812 |
| Stop Loss |
1.3500 |
| Key Levels |
0.7812, 0.9765, 1.1718, 1.2695, 1.5625, 1.7578, 1.9980 |
John Isige is an experienced cryptocurrency journalist and market analyst specializing in digital assets, blockchain innovation, and emerging Web3 trends. He provides clear, actionable market insights for traders and investors, with particular expertise in DeFi, smart contracts, NFTs, RWAs, and AI-powered blockchain ecosystems. His commentary and analysis have been featured in FORECK.INFO, CoinGape, CryptoNews, and other leading digital finance publications