

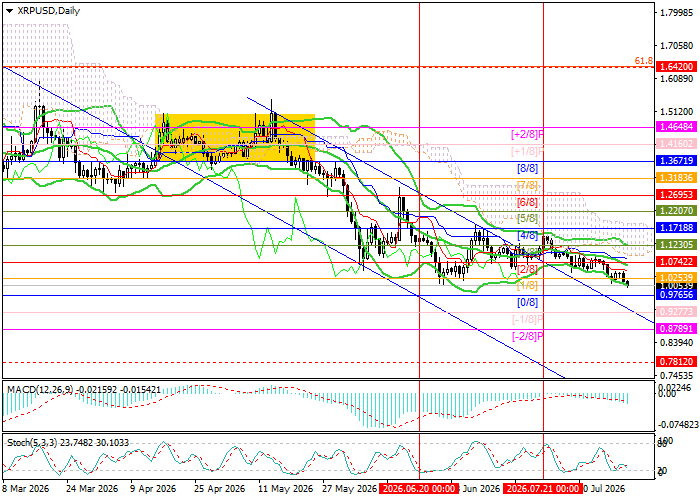
The price is currently attempting to break below the lower boundary of the range. A consolidation below this area and the 0.9765 level, corresponding to Murrey [0/8], could open the way toward 0.8789, the Murrey [–2/8] level, and 0.7812, the weekly Murrey [2/8] level. However, a breakout above 1.1718, the Murrey [4/8] level, could signal a reversal of the current trend and a recovery toward 1.3671, the Murrey [8/8] level, 1.4648, the Murrey [+2/8] level, and 1.6420, the 61.8% Fibonacci retracement.
Technical indicators continue to provide a bearish signal: the Bollinger Bands are turning lower, the MACD histogram is expanding in negative territory, while the Stochastic Oscillator remains flat near the oversold zone. On the weekly time frame, the Bollinger Bands are also pointing downward, supporting the broader bearish trend, while the price structure resembles a flag pattern, which could increase the risk of a further decline if the bearish setup is confirmed.
Support and Resistance Levels
Resistance levels: 1.1718, 1.3671, 1.4648, 1.6420.
Support levels: 0.9765, 0.8789, 0.7812.
XRP/USD Trading Scenarios and Forecast
Short positions may be considered below 0.9765, with targets at 0.8789 and 0.7812 and a stop-loss at 1.0450. Time horizon: 5–7 days.
Long positions may be considered above 1.1718, with targets at 1.3671, 1.4648 and 1.6420 and a stop-loss at 1.0950.
