

Technical indicators offer mixed signals: Bollinger Bands remain flat, the MACD histogram holds steady in the negative zone, and the Stochastic oscillator is pointing upward but approaching the overbought area.
On the weekly chart, the trend is attempting to turn downward, confirmed by a “bearish divergence” pattern between the price chart and the MACD histogram, reinforcing the likelihood of further XRP/USD decline.
Support and Resistance Levels
Resistance levels: 2.9297, 3.1250.
Support levels: 2.7344, 2.5391, 2.3438.
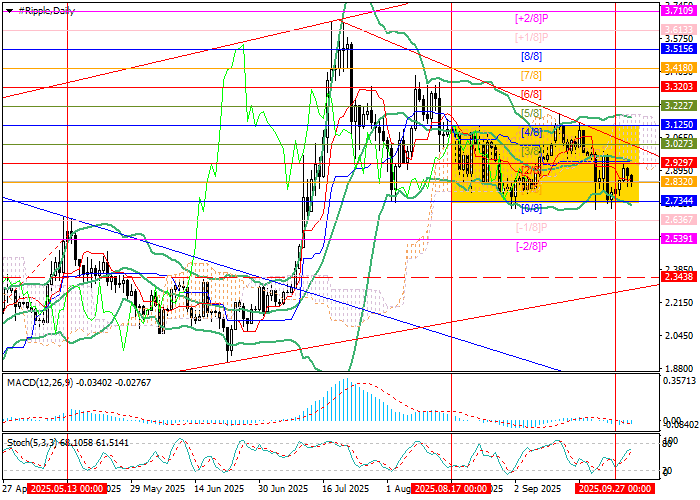
Trading Scenarios and XRP/USD Forecast
Short positions may be considered below 2.7344 with targets at 2.5391 and 2.3438, while placing a stop-loss at 2.8900. Timeframe: 5–7 days.
Long positions may be opened above 2.9297 with a target at 3.1250 and a stop-loss at 2.7800.
Scenario
| Timeframe | Weekly |
| Recommendation | SELL STOP |
| Entry Point | 2.7180 |
| Take Profit | 2.5391, 2.3438 |
| Stop Loss | 2.8900 |
| Key Levels | 2.3438, 2.5391, 2.7344, 2.9297, 3.1250 |
Alternative Scenario
| Recommendation | BUY STOP |
| Entry Point | 2.9460 |
| Take Profit | 3.1250 |
| Stop Loss | 2.7800 |
| Key Levels | 2.3438, 2.5391, 2.7344, 2.9297, 3.1250 |
