

Today, quotes declined toward 80700.00 after US President Donald Trump stated that the new version of Tehran’s peace proposals was unacceptable. Nevertheless, overall sentiment in the cryptocurrency market is slowly improving. The Fear and Greed Index returned to the neutral zone at 48, while Bitcoin ETF balances increased by 631.6 million dollars over the past week. Investors are awaiting the release of US inflation data for April on Tuesday at 14:30 (GMT+2). The Consumer Price Index is expected to rise from 3.3% to 3.7% year-on-year. If this forecast is confirmed, Federal Reserve officials may shift toward a more hawkish stance, while interest rates could remain unchanged until the end of the year and may even be raised early next year. This would put pressure on assets that serve as alternatives to the US dollar.
Traders are also focused on Thursday’s hearings in the Senate Banking Committee on the Clarity Act, a bill aimed at improving transparency in the digital asset sector. Its approval would be an important step toward creating clearer legal rules for the industry and could support a significant strengthening of major tokens. The bill prohibits stablecoin issuers from offering clients yield based on holding tokens, since such programs resemble traditional bank deposits and could trigger an outflow of funds from the conventional financial system. However, other types of rewards related to coin operations remain permitted. It is worth noting that the document will later be combined with the version approved by the Senate Agriculture Committee in January, and only after that will it be submitted for a full vote.
Ahead of these key events, market participants may adopt a wait-and-see approach. However, the broader conditions for moderate growth in the asset remain in place.
Support and Resistance Levels
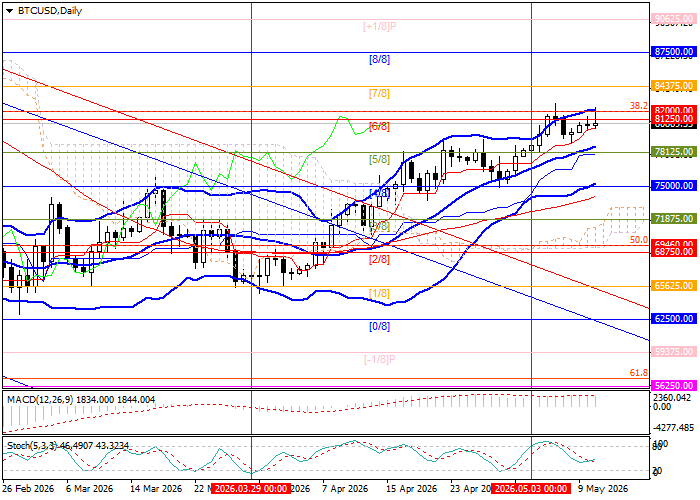
The trading instrument is testing the resistance zone of 81250.00–82000.00, formed by the Murray level [+2/8] and the 38.2% Fibonacci retracement. A breakout above this area could open the way toward 87500.00, the Murray level [8/8], and 90625.00, the Murray level [+1/8]. However, if the price again breaks below the lower line of the Bollinger Bands at 75000.00, the Murray level [4/8], the decline may resume toward 68750.00, the Murray level [2/8] and the 50.0% Fibonacci retracement, followed by 62500.00, the Murray level [0/8].
Technical indicators continue to give a buy signal: Bollinger Bands are directed upward, the MACD histogram remains stable in positive territory, and the Stochastic has shifted to horizontal movement.
Resistance levels: 82000.00, 87500.00, 90625.00.
Support levels: 75000.00, 68750.00, 62500.00.
BTC/USD Trading Scenarios and Price Forecast
Long positions may be opened above 82000.00, with targets at 87500.00 and 90625.00 and a stop-loss at 77600.00. Implementation period: 5–7 days.
Short positions may be opened below 75000.00, with targets at 68750.00 and 62500.00 and a stop-loss at 77100.00.
Scenario
| Timeframe | Weekly |
| Recommendation | BUY STOP |
| Entry Point | 82050.00 |
| Take Profit | 87500.00, 90625.00 |
| Stop Loss | 77600.00 |
| Key Levels | 62500.00, 68750.00, 75000.00, 82000.00, 87500.00, 90625.00 |
Alternative Scenario
| Recommendation | SELL STOP |
| Entry Point | 74930.00 |
| Take Profit | 68750.00, 62500.00 |
| Stop Loss | 77100.00 |
| Key Levels | 62500.00, 68750.00, 75000.00, 82000.00, 87500.00, 90625.00 |
