

In April, nonfarm payrolls changed from 185.0 thousand to 115.0 thousand, significantly above the expected 62.0 thousand. Average hourly earnings accelerated from 3.4% to 3.6% year-on-year, although analysts had forecast 3.8%, while the monthly figure remained at 0.2% against expectations of 0.3%. The unemployment rate stayed unchanged at 4.3%, matching analysts’ forecasts. Investors also focused on the University of Michigan’s revised inflation expectations: one-year expectations for May declined from 4.7% to 4.5%, while five-year expectations eased from 3.5% to 3.4%. This slightly reduces traders’ expectations of possible further monetary tightening by the U.S. Federal Reserve, although the broader market picture has not changed significantly. Meanwhile, the Consumer Sentiment Index fell from 49.8 points to 48.2 points, against forecasts of 49.5 points.
Geopolitical tensions in the Middle East remain the dominant source of volatility for the instrument, directly affecting hydrocarbon prices and, through inflation expectations, the U.S. dollar. On May 10, the U.S. Navy disabled two Iranian oil tankers after an exchange of fire with the Islamic Revolutionary Guard Corps (IRGC) in the Strait of Hormuz, which marked a direct violation of existing agreements. The United Arab Emirates (UAE) reported another missile and drone attack by the Islamic Republic. U.S. Secretary of State Marco Rubio warned of tough retaliatory measures if American facilities were damaged, while Iranian Foreign Minister Abbas Araghchi accused Washington of choosing escalation every time the sides come close to a diplomatic settlement.
Structural demand factors for gold remain strongly bullish and continue to support the broader upward trend. According to UBS Group AG’s April report, global central banks are expected to purchase between 800.0 and 850.0 tonnes of gold in 2026, only slightly below the record 860.0 tonnes bought in 2025 and in line with a 15-year trend of steady reserve accumulation. The dollar’s share in global reserves has fallen from around 60.0% in the early 2000s to 40.0%, while gold’s share has tripled to 30.0%. According to the U.S. Commodity Futures Trading Commission (CFTC), net speculative positions in gold increased slightly last week from 159.6 thousand to 163.3 thousand. Investors continue to hold large long positions: among real-money-backed positions, bulls account for around 124.667 thousand contracts versus 29.003 thousand held by bears. Buyers increased their positions by 0.385 thousand, while sellers reduced theirs by 3.705 thousand.
Support and resistance levels
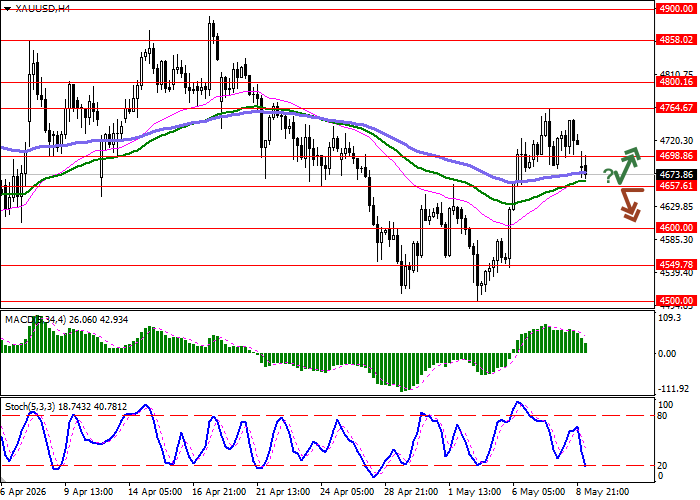
On the daily chart, Bollinger Bands are moving horizontally, while the price range is narrowing from above, limiting the bulls’ path toward new highs. The MACD indicator is declining but still maintains a buy signal, with the histogram remaining above the signal line. The Stochastic oscillator, after reversing near the overbought area, points to the possibility of a full corrective move in the short term.
Resistance levels: 4698.86, 4764.67, 4800.16, 4858.02.
Support levels: 4657.61, 4600.00, 4549.78, 4500.00.
Trading scenarios and XAU/USD forecast
Short positions may be opened after a breakdown below 4657.61, with the target at 4549.78. Stop-loss — 4698.86. Timeframe: 2–3 days.
Long positions may be opened after a rebound from 4657.61 and a breakout above 4698.86, with the target at 4800.16. Stop-loss — 4657.61.
Scenario
| Timeframe | Intraday |
| Recommendation | SELL STOP |
| Entry point | 4657.60 |
| Take Profit | 4549.78 |
| Stop Loss | 4698.86 |
| Key levels | 4500.00, 4549.78, 4600.00, 4657.61, 4698.86, 4764.67, 4800.16, 4858.02 |
Alternative scenario
| Recommendation | BUY STOP |
| Entry point | 4698.90 |
| Take Profit | 4800.16 |
| Stop Loss | 4657.61 |
| Key levels | 4500.00, 4549.78, 4600.00, 4657.61, 4698.86, 4764.67, 4800.16, 4858.02 |
