

Positive data from China points to a possible increase in demand for oil and petroleum products. In April, the Consumer Price Index rose from 1.0% to 1.2% year-on-year, compared with forecasts of 0.8%, and from –0.7% to 0.3% month-on-month. The Producer Price Index advanced from 0.5% to 2.8%, against expectations of 1.5%, reaching 45-month highs after a prolonged period of deflation.
The U.S.–Iran confrontation remains in focus. Today, U.S. President Donald Trump rejected Iran’s counterproposal for a diplomatic settlement. Official Tehran submitted to Washington a list of preliminary conditions, including an immediate end to the naval blockade of ports, the restoration of free hydrocarbon exports, the removal of all sanctions, the unfreezing of assets, official recognition of the Islamic Republic’s control over the Strait of Hormuz, and compensation for damage caused during the hostilities. At the same time, Iran proposed discussing its nuclear program only as part of a separate agreement. Nevertheless, active hostilities have not resumed, and traders hope the situation may change after the White House leader’s visit to China on May 13–15, where the conflict in the Persian Gulf could become a central topic of discussion.
From March 1 to April 25, global commercial hydrocarbon inventories declined by around 4.8 million barrels per day, which analysts estimate is significantly higher than previous quarterly negative peaks recorded by the International Energy Agency (IEA). According to Bloomberg, citing Morgan Stanley estimates, about 60.0% of the decline came from crude oil, while the rest was attributed to refined products, including fuels and distillates. The rapid depletion of reserves is increasing structural pressure on the market and creating conditions for elevated price volatility in the medium term, especially if new supply chain disruptions occur. The report notes that countries and oil companies now have fewer tools to offset a major reduction in supply caused by the closure of the Strait of Hormuz. Additional concern is being fueled by Goldman Sachs Group Inc., which sees only signs of a slowdown in the negative trend, while noting that global inventory levels have already approached their 2018 lows. The most vulnerable remain import-dependent Asian countries such as Indonesia, Vietnam, Pakistan, and the Philippines, where critical supply levels could be reached within a month. Larger regional economies, including China, remain relatively resilient for now. In the EU, jet fuel inventories continue to decline rapidly, adding further pressure to the energy balance.
Support and resistance levels
On the daily chart, Bollinger Bands are moving upward, while the price range is narrowing but remains wide enough for the current level of market activity. The MACD indicator keeps its previous sell signal, with the histogram holding below the signal line. Traders should wait for clearer indicator signals. The Stochastic oscillator has turned upward near the oversold area, reflecting the possibility of a short-term upward trend.
Resistance levels: 103.81, 106.00, 109.00, 112.00.
Support levels: 100.00, 96.54, 94.50, 91.00.
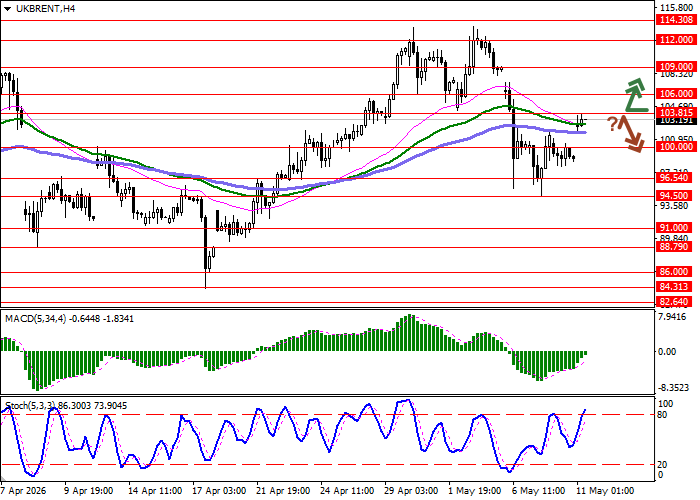
Trading scenarios and Brent Crude Oil forecast
Long positions may be opened after a breakout above 103.81, with the target at 112.00. Stop-loss — 100.00. Timeframe: 2–3 days.
Short positions may be opened after a rebound from 103.81 and a breakdown below 100.00, with the target at 94.50. Stop-loss — 103.81.
Scenario
| Timeframe | Intraday |
| Recommendation | BUY STOP |
| Entry point | 103.85 |
| Take Profit | 112.00 |
| Stop Loss | 100.00 |
| Key levels | 91.00, 94.50, 96.54, 100.00, 103.81, 106.00, 109.00, 112.00 |
Alternative scenario
| Recommendation | SELL STOP |
| Entry point | 99.95 |
| Take Profit | 94.50 |
| Stop Loss | 103.81 |
| Key levels | 91.00, 94.50, 96.54, 100.00, 103.81, 106.00, 109.00, 112.00 |
