

Another factor putting pressure on prices, according to experts, is investors’ reaction to reports that the United Arab Emirates (UAE) may leave the OPEC+ deal and the cartel itself, citing the need for greater flexibility in production policy. Traders fear that outside the framework of voluntary restrictions, the country could significantly increase output, weakening the asset.
According to analysts’ estimates, global hydrocarbon inventories fell by a record 200.0 million barrels in April, despite lower demand caused by rising raw material prices amid the U.S.-Iran conflict. According to S&P Global Energy, global supply declined by 6.6 million barrels per day over the month, while consumption fell by 5.0 million barrels per day, the second-largest drop on record after the decline during the COVID-19 pandemic. Experts at The Goldman Sachs Group Inc. add that global inventories are now close to their lowest levels in the past eight years. In Northern Europe, according to Argus Media Ltd, aviation fuel reserves reached a six-year low in April. As the Financial Times notes, total global stocks of “black gold” amount to around 4.0 billion barrels, but a significant part of them is already involved in current operational processes required for the stable operation of refineries and pipeline transportation.
According to statistics from the American Petroleum Institute (API), U.S. fuel inventories changed from –1.790 million barrels to –8.100 million barrels, while the U.S. Energy Information Administration (EIA) reported a change from –6.234 million barrels to –2.313 million barrels.
At the beginning of the month, investor activity increased noticeably, and trading volumes are now close to the average levels seen in early April. According to the Chicago Mercantile Exchange (CME Group), on May 6 the number of futures contracts reached 1.58 million, the highest level in the past month and above the 1.35 million recorded on April 17. The number of options transactions amounted to 356,000 compared with the May median of 214,000.
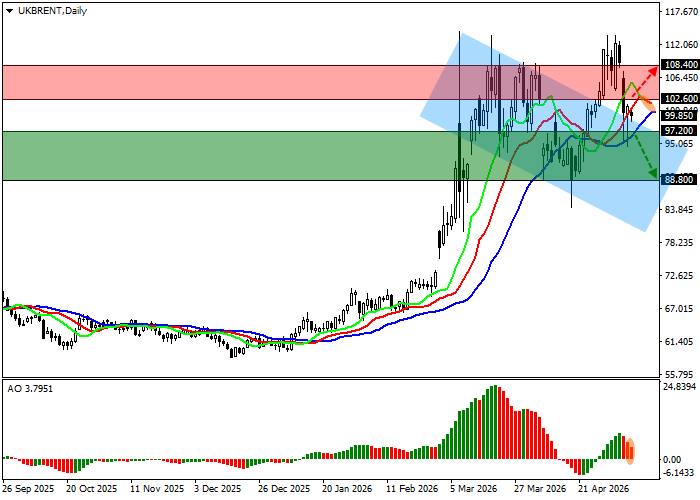
Support and resistance levels
On the daily chart, the trading instrument has returned below the resistance line of the descending channel with boundaries at 102.00–84.00 and may continue to decline next week.
Technical indicators are slowing the buy signal: the fast EMAs of the Alligator indicator are approaching the signal line from above, while the AO histogram is forming downward bars in positive territory.
Resistance levels: 102.60, 108.40.
Support levels: 97.20, 88.80.
Trading scenarios and Brent Crude Oil forecast
Short positions may be opened after the price declines and consolidates below 97.20, with a target of 88.80. Stop-loss — 101.00. The expected implementation period is 7 days or more.
Long positions may be opened after the price rises and consolidates above 102.60, with a target of 108.40. Stop-loss — 99.00.
Scenario
| Timeframe | Weekly |
| Recommendation | SELL STOP |
| Entry point | 97.15 |
| Take Profit | 88.80 |
| Stop Loss | 101.00 |
| Key levels | 88.80, 97.20, 102.60, 108.40 |
Alternative scenario
| Recommendation | BUY STOP |
| Entry point | 102.65 |
| Take Profit | 108.40 |
| Stop Loss | 99.00 |
| Key levels | 88.80, 97.20, 102.60, 108.40 |
