

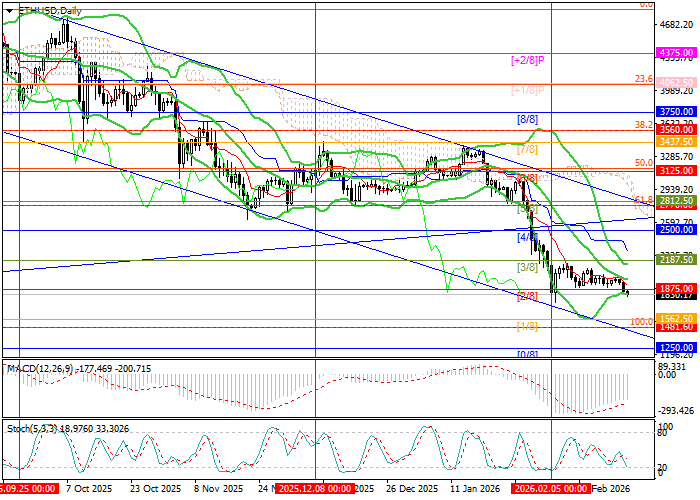
At present, the price is testing the lower boundary of this range. A confirmed breakdown below it could lead to a move toward 1481.50 (100.0% Fibonacci retracement) and 1250.00 (Murray level [0/8]). Conversely, consolidation above the 2500.00 area (Murray level [4/8]) would signal a potential trend reversal, a breakout from the range, and growth toward 3125.00 (Murray level [6/8], 50.0% Fibonacci retracement) and 3750.00 (Murray level [8/8]).
Technical indicators continue to point to a sell signal: Bollinger Bands and the Stochastic oscillator are turning downward, although the latter is approaching oversold territory, while the MACD histogram remains stable in negative territory. It is also worth noting that on the weekly chart, Bollinger Bands are trending lower, reinforcing the relevance of a continued bearish trend.
Support and Resistance Levels
Resistance levels: 2500.00, 3125.00, 3750.00.
Support levels: 1875.00, 1481.50, 1250.00.
Trading Scenarios and ETH/USD Forecast
Short positions can be opened from the 1800.00 level with targets at 1481.50 and 1250.00, and a stop-loss at 2050.00. Time horizon: 5–7 days.
Long positions can be opened above the 2500.00 level with targets at 3125.00 and 3750.00, and a stop-loss at 2200.00.
Scenario
| Timeframe | Weekly |
| Recommendation | SELL STOP |
| Entry Point | 1800.00 |
| Take Profit | 1481.50, 1250.00 |
| Stop Loss | 2050.00 |
| Key Levels | 1250.00, 1481.50, 1875.00, 2500.00, 3125.00, 3750.00 |
Alternative Scenario
| Recommendation | BUY STOP |
| Entry Point | 2540.00 |
| Take Profit | 3125.00, 3750.00 |
| Stop Loss | 2200.00 |
| Key Levels | 1250.00, 1481.50, 1875.00, 2500.00, 3125.00, 3750.00 |
