

The company participated in the recently concluded Citi Global Industrial Tech and Mobility Conference, where it presented key financial and operating metrics: by the end of 2025, sales reached $88.0 billion, while the total backlog amounted to $268.0 billion, up 23.0% from 2024, indicating a significant increase in active contracts, including international agreements, which accounted for more than 30.0% of the total and rose by 4.0% over two years. The partnership with the US Department of Defense currently includes five active agreements to expand munitions production, while the Pratt & Whitney GTF turbofan engine program has nearly tripled in size to 8.0 thousand units.
These figures reflect steady demand for the corporation’s products in both the commercial aviation and defense segments. As part of its strategy to maintain industry leadership, management plans to allocate $10.0 billion to engineering development and capital expenditures, which should increase production capacity, accelerate the adoption of new technologies, and strengthen positions in key markets. It is worth noting that RTX Corp.’s positive momentum also supports the financial sector, stimulates demand for high-tech materials and services, improves supply chains, and accelerates economic recovery in the regions where it operates.
The fourth-quarter financial report was published earlier this month: according to the document, revenue increased from $22.48 billion to $24.20 billion versus $21.62 billion a year earlier, while earnings per share (EPS) declined from $1.70 to $1.55 versus $1.54, respectively. The next dividend payment is scheduled for March 19 and will amount to $0.68 per share, corresponding to a 1.32% yield, slightly above the industry average of 1.06%.
Support and resistance levels
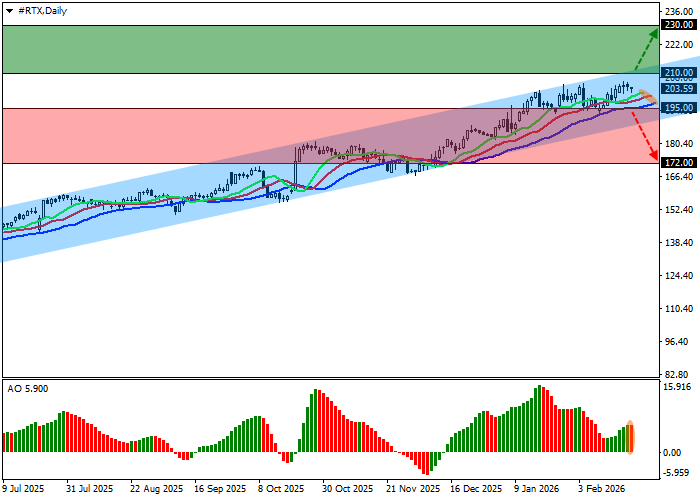
On the daily chart, the instrument is trading above the support line of an ascending channel with dynamic boundaries at 215.00–190.00.
Technical indicators continue to hold a buy signal: the Alligator indicator has widened its fluctuation range, the fast EMAs remain above the signal line, and the AO histogram is forming rising bars in positive territory.
Resistance levels: 210.00, 230.00.
Support levels: 195.00, 172.00.
Trading scenarios and RTX Corp price forecast
Long positions may be opened after growth and consolidation above the 210.00 level with a target at 230.00 and a stop-loss at 200.00. Timeframe for implementation: 7 days or more.
Short positions may be opened after a decline and consolidation below the 195.00 level with a target at 172.00. Stop-loss at 205.00.
Scenario
| Timeframe | Weekly |
| Recommendation | BUY STOP |
| Entry point | 210.05 |
| Take Profit | 230.00 |
| Stop Loss | 200.00 |
| Key levels | 172.00, 195.00, 210.00, 230.00 |
Alternative scenario
| Recommendation | SELL STOP |
| Entry point | 194.95 |
| Take Profit | 172.00 |
| Stop Loss | 205.00 |
| Key levels | 172.00, 195.00, 210.00, 230.00 |
