

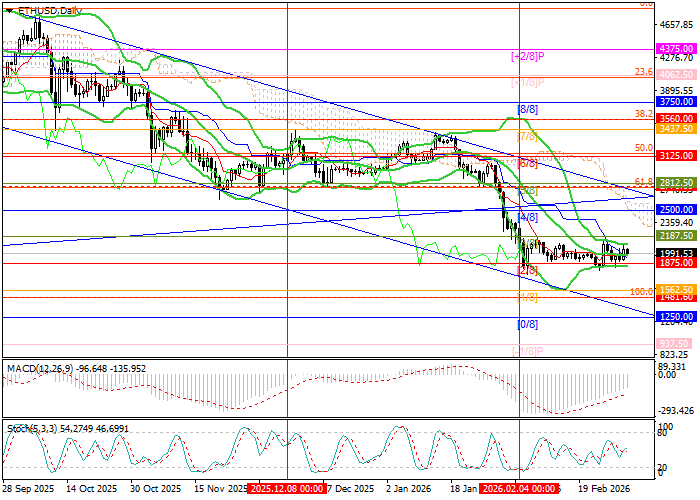
Technical indicators are mixed. Bollinger Bands and Stochastic remain flat, while the MACD histogram holds steady in negative territory. It is also worth noting that price remains within a long-term descending channel, and on the weekly chart Bollinger Bands continue to point lower, confirming the broader bearish trend. In this context, the current sideways movement can be interpreted as a flag pattern, which increases the probability of another downside leg.
Support and resistance levels
Resistance levels: 2187.50, 2500.00, 2812.50, 3125.00.
Support levels: 1875.00, 1481.50, 1250.00.
Trading scenarios and ETH/USD forecast
Short positions may be considered below 1875.00 with targets at 1481.50 and 1250.00, with a stop-loss at 2090.00. Timeframe: 5–7 days.
Long positions may be considered above 2187.50 with targets at 2500.00, 2812.50, and 3125.00, with a stop-loss at 1930.00.
Scenario
Timeframe: Weekly
Recommendation: SELL STOP
Entry Point: 1865.00
Take Profit: 1481.50, 1250.00
Stop Loss: 2090.00
Key Levels: 1250.00, 1481.50, 1875.00, 2187.50, 2500.00, 2812.50, 3125.00
Alternative Scenario
Recommendation: BUY STOP
Entry Point: 2190.00
Take Profit: 2500.00, 2812.50, 3125.00
Stop Loss: 1930.00
Key Levels: 1250.00, 1481.50, 1875.00, 2187.50, 2500.00, 2812.50, 3125.00
