

In particular, the risk of a missile strike on Iran, hinted at by President Donald Trump amid the withdrawal of U.S. troops from key regional facilities, including the Al Udeid Air Base in Qatar, as well as potential steps toward the annexation of Greenland, could lead to a number of negative consequences. These include a prolonged military conflict in the Middle East, a reduction in economic ties between Washington and Brussels, the introduction of new reciprocal sanctions, and increased pressure on U.S. companies operating in the eurozone. Heightened uncertainty remains the primary driver behind the reallocation of investor capital into alternatives to the U.S. dollar.
Monetary factors are also weighing on the U.S. currency. The possibility of criminal proceedings against Fed Chair Jerome Powell over the alleged misuse of funds allocated for the reconstruction of the Federal Reserve’s headquarters in Washington, along with signs of slowing inflation (the core consumer price index in December stood at 2.6% versus a preliminary estimate of 2.7%), has strengthened market confidence that authorities will continue easing monetary conditions—if not in January, then certainly later this year. This environment further supports cryptocurrencies. On January 13, U.S. spot Bitcoin ETFs recorded net inflows of $753.8 million, the largest single-day figure in three months, according to Farside Investors and SoSoValue. In addition, the Fear and Greed Index entered the “greed” zone at 61 for the first time since October of last year.
Medium-term support for SOL prices is also driven by expectations surrounding the January 21 launch of Solana Mobile’s new token, SKR. The total supply will be capped at 10.0 billion tokens, with 20.0% already reserved for an airdrop. These tokens will be distributed to Seeker smartphone users, app developers, and participants in the Solana ecosystem. The remaining supply will be allocated to market liquidity, application development incentives, and strategic partners. SKR will follow a linear inflation model designed to reward early ecosystem participants, primarily stakers. At launch, annual issuance will amount to 10.0% of total supply, or 1.0 billion SKR, after which the rate will decrease by 25.0% per year until stabilizing at 2.0%.
Support and resistance levels
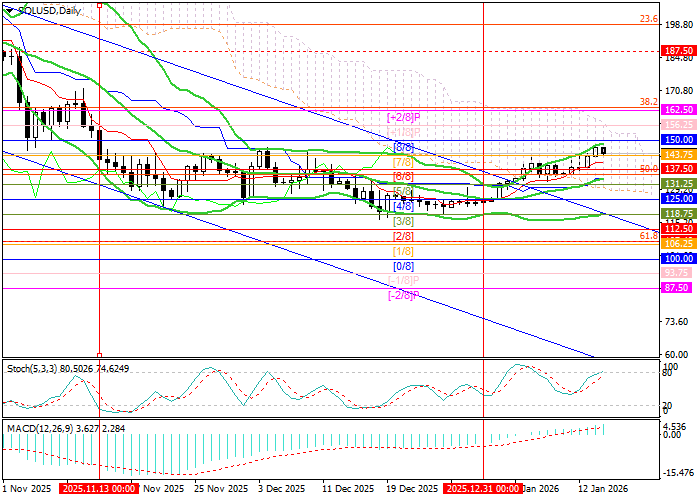
The instrument has exited its medium-term descending channel and is preparing to form a new trend. Prices are currently approaching the 150.00 level (Murray [8/8]); a breakout above it would open the way for further growth toward 162.50 (Murray [+2/8], Fibonacci 38.2%) and 187.50 (Murray [6/8], W1). The key level for bears is 125.00 (Murray [4/8], below the Bollinger Bands’ midline). A break below this area would return the price to the channel, with a potential move toward 107.40 (Fibonacci 61.8%) and 93.75 (Murray [–1/8]).
Technical indicators do not rule out a continuation of the bullish move: Bollinger Bands are turning upward, the MACD histogram is expanding in positive territory, while the Stochastic is approaching overbought levels, leaving room for a corrective pullback, although its potential currently appears limited.
Resistance levels: 150.00, 162.50, 175.00.
Support levels: 125.00, 107.40, 93.75.
Trading scenarios and Solana price forecast
Long positions may be opened above 143.75 with targets at 162.50 and 175.00, and a stop loss at 141.00. Time horizon: 5–7 days.
Short positions may be opened below 125.00 with targets at 107.40 and 93.75, and a stop loss at 136.00.
Scenario
| Timeframe | Weekly |
| Recommendation | BUY STOP |
| Entry point | 150.50 |
| Take Profit | 162.50, 175.00 |
| Stop Loss | 141.00 |
| Key levels | 93.75, 107.40, 125.00, 150.00, 162.50, 175.00 |
Alternative scenario
| Recommendation | SELL STOP |
| Entry point | 124.50 |
| Take Profit | 107.40, 93.75 |
| Stop Loss | 136.00 |
| Key levels | 93.75, 107.40, 125.00, 150.00, 162.50, 175.00 |
