

Over the weekend, reports emerged that criminal proceedings had been initiated against Fed Chair Jerome Powell over the alleged misuse of funds for the reconstruction of the Fed’s Washington headquarters—said to total $2.5 billion—an issue he had previously addressed in a report to Congress. Powell called the move politically motivated and aimed at increasing pressure on monetary authorities to cut interest rates, stressing that the Fed is currently acting “based on its best assessment of what will benefit society, rather than following the president’s preferences.”
In the longer run, the case could lead to Powell’s early removal and a transition of leadership to Kevin Hassett—widely described as the current administration’s leading candidate and ally—who supports more aggressive easing even amid elevated inflation risks. Still, according to Polymarket, the probability of Powell being removed is currently only 8.0%, while 67.0% of participants expect him to serve out his four-year term. Even so, the renewed pressure campaign has unsettled markets, pushing some participants back toward assets viewed as alternatives to the dollar. The current rebound, however, does not look durable, as overall sentiment in the crypto community remains negative. That is reflected in sizeable outflows from Bitcoin ETFs, which totaled $680.9 million last week, while the Fear & Greed Index remains in “fear” territory at 27.
Support and Resistance Levels
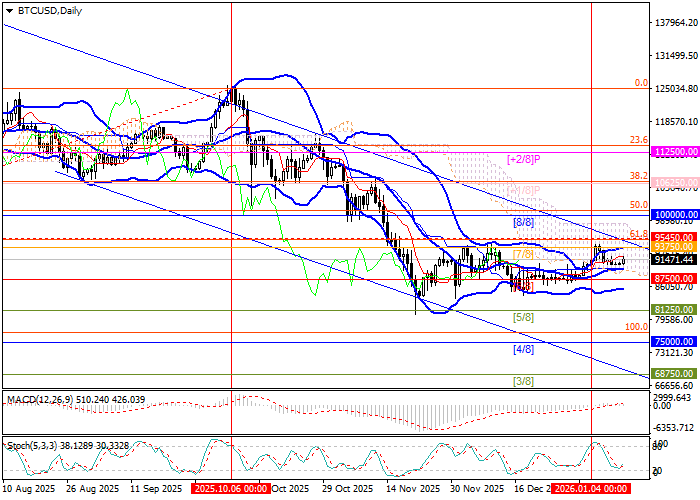
Despite the ongoing uptick, price is still trading within a descending channel and is approaching its upper boundary. For bulls, the key resistance zone is seen at 93,700.00–95,450.00 (Murray [7/8], 61.8% Fibonacci retracement). A sustained break above this area would open the way to 106,250.00 (Murray [+1/8], 38.2% Fibonacci retracement) and 112,500.00 (Murray [+2/8]). For bears, the critical level is 87,500.00 (Murray [6/8]); a break below would signal a resumption of the decline toward 81,250.00 (Murray [5/8]) and 75,000.00 (Murray [4/8]).
Technical indicators allow for further upside: Bollinger Bands and Stochastic are turning higher, while the MACD histogram is hovering near the zero line with relatively small volumes.
Resistance levels: 95,450.00, 106,250.00, 112,500.00.
Support levels: 87,500.00, 81,250.00, 75,000.00.
Trading Scenarios and BTC/USD Forecast
Long positions can be considered above 95,450.00 with targets at 106,250.00 and 112,500.00, and a stop-loss at 89,700.00. Time horizon: 5–7 days.
Short positions can be considered below 87,500.00 with targets at 81,250.00 and 75,000.00, and a stop-loss at 92,150.00.
Scenario
| Timeframe | Weekly |
| Recommendation | BUY STOP |
| Entry Point | 95,500.00 |
| Take Profit | 106,250.00, 112,500.00 |
| Stop Loss | 89,700.00 |
| Key Levels | 75,000.00, 81,250.00, 87,500.00, 95,450.00, 106,250.00, 112,500.00 |
Alternative Scenario
| Recommendation | SELL STOP |
| Entry Point | 87,450.00 |
| Take Profit | 81,250.00, 75,000.00 |
| Stop Loss | 92,150.00 |
| Key Levels | 75,000.00, 81,250.00, 87,500.00, 95,450.00, 106,250.00, 112,500.00 |
