

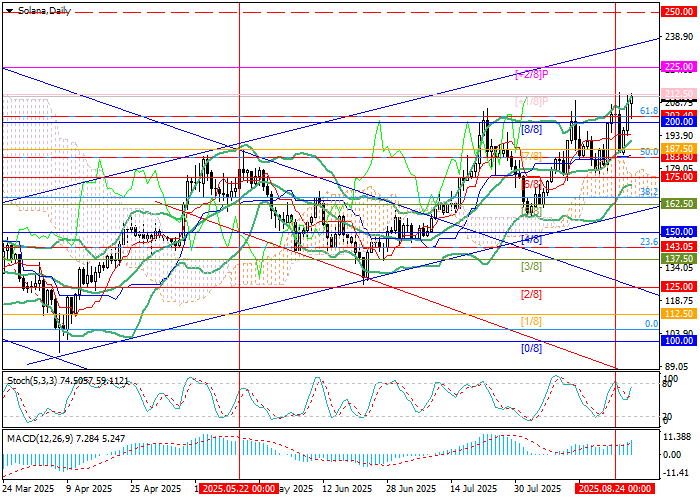
This week, price action has been mixed: initially correcting toward the middle Bollinger Band line (Murray level [7/8]), then recovering lost ground and currently testing 212.50 (Murray level [+1/8]) near seven-month highs. A breakout above this level would allow the price to continue rising toward 225.00 (Murray level [+2/8]) and 250.00 (Murray level [8/8], W1, upper boundary of the ascending channel). For bears, the key support zone lies at 187.50–183.80 (Murray level [7/8], 50.0% Fibonacci retracement). A breakdown below this zone could trigger renewed downside momentum with the potential to exit the channel toward 162.50 (Murray level [5/8]) and 143.05 (23.6% Fibonacci retracement), though this scenario currently seems less likely.
Technical indicators confirm the prevailing trend: Bollinger Bands and Stochastic are pointing upward, while MACD is strengthening in positive territory. On the weekly chart, prices are also forming an upward trend, reinforcing the case for further gains.
Support and Resistance Levels
Resistance levels: 212.50, 225.00, 250.00.
Support levels: 183.80, 162.50, 143.05.
Trading Scenarios forecast
Long positions may be opened above 212.50 with targets at 225.00 and 250.00, and a stop-loss at 205.00. Implementation period: 5–7 days.
Short positions may be opened below 183.80 with targets at 162.50 and 143.05, and a stop-loss at 196.50.
Scenario
Timeframe: Weekly forecast
Recommendation: BUY STOP
Entry Point: 214.50
Take Profit: 225.00, 250.00
Stop Loss: 205.00
Key Levels: 143.05, 162.50, 183.80, 212.50, 225.00, 250.00
Alternative Scenario
Recommendation: SELL STOP
Entry Point: 183.20
Take Profit: 162.50, 143.05
Stop Loss: 196.50
Key Levels: 143.05, 162.50, 183.80, 212.50, 225.00, 250.00