

$BTC is at a make-or-break level:
— Swissblock (@swissblock__) August 26, 2025
$110K = lifeline support
$121K = ceiling to break
In short: BTC has proven resilience above $100K, but survival above $110K will decide if the trend continues bullish or tips into structural weakness. pic.twitter.com/g24CMc96cN
Experts at the company believe that holding this level is essential to maintaining the bullish trend. The “ceiling” that needs to be broken for continued growth is $121,000.
Analyst AlphaBTC also highlighted the importance of the $110,000–112,000 zone.
📈#Bitcoin game plan 📈
— AlphaBTC (@mark_cullen) August 27, 2025
Lower time frame view as $BTC attempts to break back out of the June / July range.
For me, until we get a H4 close above 112K I still feel 105K is in play, so I will be watching that level closely.#Crypto #BTC https://t.co/pUUFtwwVDX pic.twitter.com/vCfRVF7s5s
According to him, a four-hour candle above this range is necessary for growth to resume. Otherwise, a pullback to $105,000 is likely.
Signs of Weakness
At the time of writing, Bitcoin is trading at $110,951 (–0.6% daily). The cryptocurrency has corrected 10.6% from its all-time high of $124,128, reached on August 14.
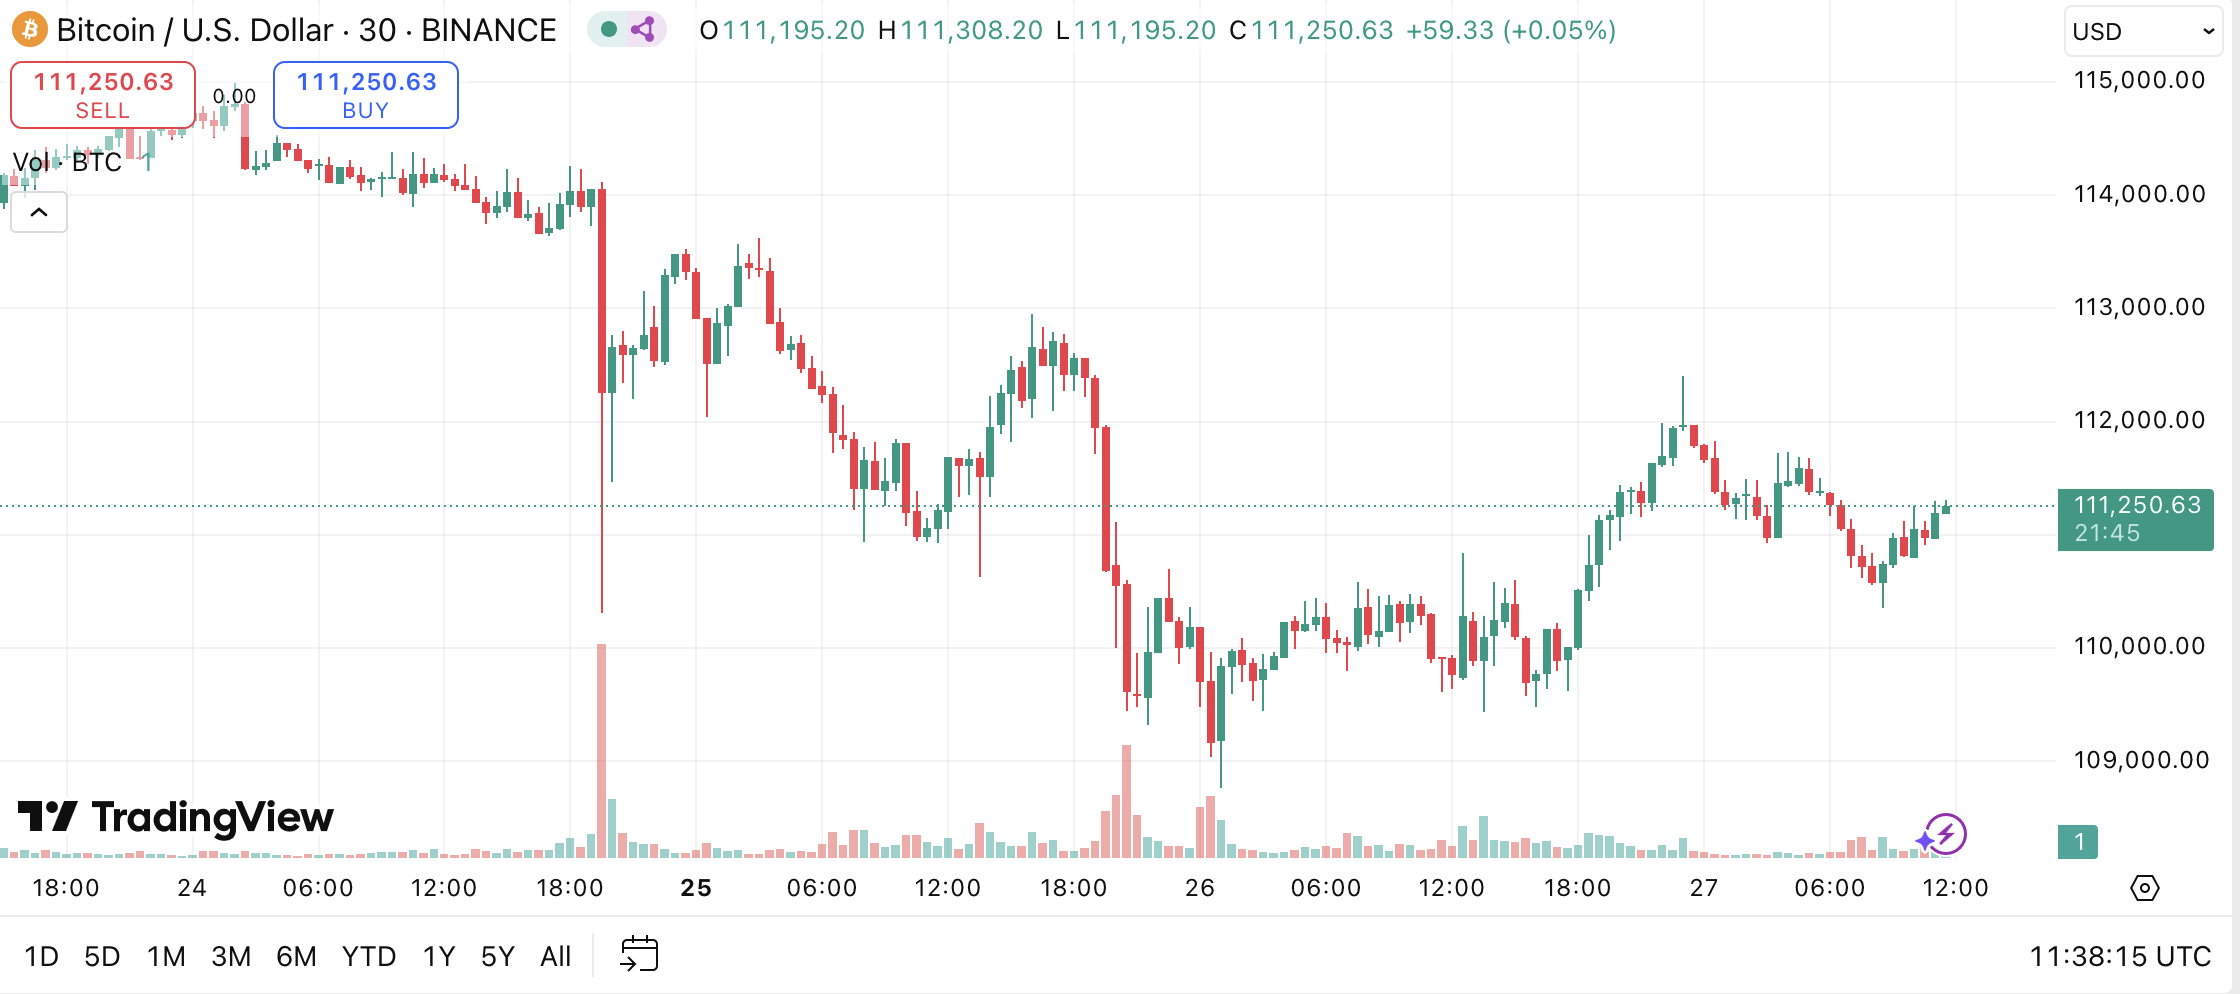 15-minute BTC/USD chart on Binance. Source: TradingView
Bitcoin’s buy-sell ratio has dropped to –0.945. Values below 1 indicate sellers’ dominance. CryptoQuant analyst Gaah noted this signals market pessimism. He recalled that similar levels were seen at the November 2021 peak, after which a correction began.
Network activity is also declining. According to Glassnode, the average monthly transfer volume fell by 13% — from $26.7 billion to $23.2 billion.
Network Activity Slowing
— glassnode (@glassnode) August 26, 2025
The monthly average of change-adjusted transfer volume has declined from $26.7B to $23.2B (~13%), tracking the pullback in price. A break below the yearly average of $21.6B would confirm weakening speculative activity and signal a broader contraction in… pic.twitter.com/gnyTokjzmA
The firm believes that a drop below the yearly average of $21.6 billion would confirm weakening demand.
Market Cooling
The market has entered a “late cycle stage,” Glassnode analysts argue. This is evidenced by a high level of realized investor profits.
#Bitcoin has now spent 273 days with a super-majority of supply held in profit (above the +1σ band) - the 2nd longest stretch on record, behind only the 2015–2018 cycle at 335 days. A signal of how extended the current cycle has been relative to history. pic.twitter.com/tYGHf21MvP
— glassnode (@glassnode) August 26, 2025
Georgiy Verbitskiy, founder of the TYMIO platform, told Decrypt he expects a “cooling period” that could last until September.
Investor sentiment is also being shaped by outflows from spot Bitcoin ETFs and macroeconomic risks. According to Ecoinometrics, if current outflows persist, the price could drop to $107,000 and even fall below the psychological level of $100,000.
ETF flows are pulling Bitcoin lower.
— ecoinometrics (@ecoinometrics) August 26, 2025
As of Friday, our flows-to-price model put the expected price at $107K, with downside risk below $100K if outflows persist.
The macro uncertainty of the past few weeks is showing up directly in the flows. pic.twitter.com/iMF3lTQlIv
Verbitskiy also does not rule out such a decline.
The expert advised against opening new long positions for now, noting that buying would only make sense after Bitcoin consolidates above $118,000.
Capital Inflows on Binance and Divergence from M2
Amid the sell-off, Binance users deposited $1.65 billion in stablecoins onto the platform. Large stablecoin inflows to exchanges often precede rising demand for cryptocurrencies.
According to CryptoQuant, this inflow coincided with the withdrawal of nearly $1 billion in Ethereum from Binance. Analyst Amr Taha noted this was the second time in a month that stablecoin inflows to the exchange exceeded $1.5 billion. He said this “highlights a new wave of capital entering the spot market.”
Bitcoin’s drop to $109,000 has also caused the sharpest divergence in two years from global M2 money supply trends. M2 measures the total amount of money in circulation.
Since the pandemic, Bitcoin has shown strong correlation with M2, typically with a lag of 2–3 months. Traders have used this relationship to forecast short-term price trends.
Here is the original version, updated. We always said it wouldn't continue to exact mirror but contextually should be correct...we've had decent size gaps the other way around in the past too and they ended up resolving by BTC catching up to M2 pic.twitter.com/NGGex4Mkjl
— Raoul Pal (@RaoulGMI) August 25, 2025
However, Real Vision founder Raoul Pal — one of the first to point out this correlation — stressed that in the long run Bitcoin is more closely tied to overall global liquidity, not just M2.
Wondering if in hindsight we will realize this M2 supply isn’t currently American enough to keep better correlation. Mostly Chinese/other
— Wil (@SlickWillie227) August 25, 2025
Note: Earlier, FORECK.INFO reported on massive outflows from crypto funds, with investors pulling $1.43 billion amid concerns over the Federal Reserve’s next policy move.