

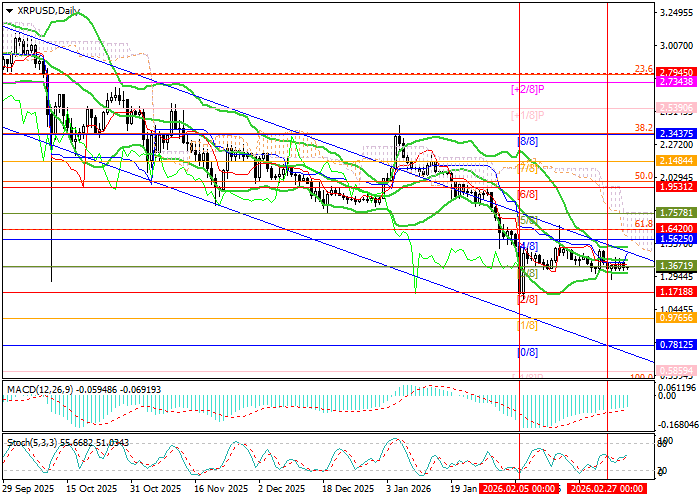
The resistance zone at 1.5625–1.6420 (Murray level [4/8], Fibonacci retracement 61.8%) remains crucial for bulls. A breakout above this range would indicate a reversal of the current trend and open the path toward targets at 1.9531 (Murray level [6/8]) and 2.3437 (Murray level [8/8], Fibonacci retracement 38.2%).
Technical indicators do not provide a unified signal. Bollinger Bands remain horizontal, while Stochastic is turning upward, indicating potential short-term bullish momentum. At the same time, the MACD histogram remains stable in the negative zone. It is also worth noting that on the weekly chart Bollinger Bands are still pointing downward, confirming the persistence of the long-term bearish trend and suggesting that further downside remains possible after the formation of a “flag” pattern.
Support and resistance levels
Resistance levels: 1.6420, 1.9531, 2.3437.
Support levels: 1.1718, 0.7812, 0.5859.
Trading scenarios and XRP/USD forecast
Short positions may be considered below the 1.1718 level with targets at 0.7812 and 0.5859 and a stop-loss at 1.4450. Implementation period: 5–7 days.
Long positions may be considered above the 1.6420 level with targets at 1.9531 and 2.3437 and a stop-loss at 1.4200.
Scenario
| Timeframe | Weekly |
| Recommendation | SELL STOP |
| Entry Point | 1.1700 |
| Take Profit | 0.7812, 0.5859 |
| Stop Loss | 1.4450 |
| Key Levels | 0.5859, 0.7812, 1.1718, 1.6420, 1.9531, 2.3437 |
Alternative Scenario
| Recommendation | BUY STOP |
| Entry Point | 1.6440 |
| Take Profit | 1.9531, 2.3437 |
| Stop Loss | 1.4200 |
| Key Levels | 0.5859, 0.7812, 1.1718, 1.6420, 1.9531, 2.3437 |
