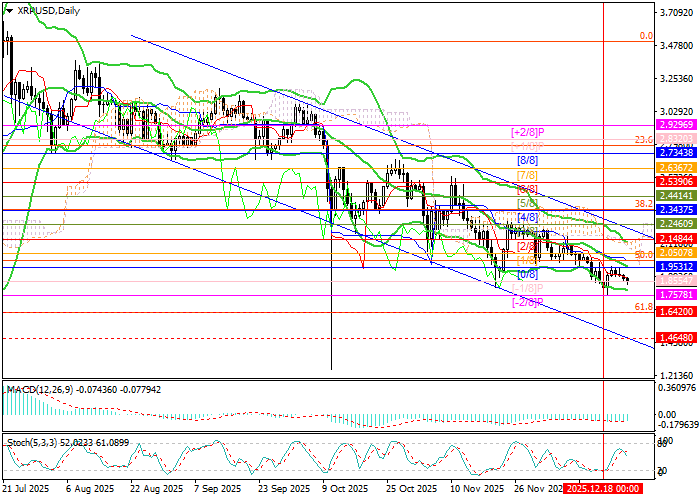
XRP/USD outlook: The XRP/USD pair is trading within a medium-term bearish trend, forming a corresponding descending channel. Last week, the price attempted a corrective rebound amid expectations that the U.S. Federal Reserve will continue its easing cycle next year, alongside the Bank of Japan’s rate hike. XRP tested the Bollinger Bands midline at 1.9531 (Murrey level [0/8]) and then resumed its decline, keeping downside targets at 1.6420 (Fibonacci retracement 61.8%) and 1.4648 (Murrey level [–2/8], H4). On the other hand, a sustained break above the upper Bollinger Band at 2.1484 (Murrey level [2/8]) would allow the asset to exit the range to the upside and move toward 2.3437 (Murrey level [4/8], Fibonacci retracement 38.2%) and 2.5390 (Murrey level [6/8]).
Technical indicators keep a sell bias: Bollinger Bands and Stochastic are pointing lower, the MACD histogram remains stable in negative territory, and on the weekly chart the instrument is declining while working through a “double top” pattern.
Support and resistance levels
Resistance: 2.1484, 2.3437, 2.5390.
Support: 1.6420, 1.4648.
Trading scenarios and XRP/USD forecast
Bearish scenario: Short positions can be opened from 1.8260 with targets at 1.6420 and 1.4648, with a stop-loss at 1.9520. Time horizon: 5–7 days.
Bullish scenario: Long positions can be opened above 2.1484 with targets at 2.3437 and 2.5390, with a stop-loss at 2.0100.
Scenario
| Timeframe |
Weekly |
| Recommendation |
SELL STOP |
| Entry point |
1.8255 |
| Take Profit |
1.6420, 1.4648 |
| Stop Loss |
1.9520 |
| Key levels |
1.4648, 1.6420, 2.1484, 2.3437, 2.5390 |
Alternative scenario
| Recommendation |
BUY STOP |
| Entry point |
2.1485 |
| Take Profit |
2.3437, 2.5390 |
| Stop Loss |
2.0100 |
| Key levels |
1.4648, 1.6420, 2.1484, 2.3437, 2.5390 |
cryptocurrency journalist and market analyst who has accumulated great experience. He shares practicable insight with traders, investors, and enthusiasts of the crypto world. John loves to explore the dynamic Web3 space, which involves blockchain technology or different coins besides decentralized applications (dApps) leading decentralized finance (DeFi), smart contracts or interoperability among blockchains, non-fungible tokens (NFTs), real-world assets (RWAs), and artificial intelligence combining blockchain. John has worked for leading cryptocurrency resources, among them FORECK.INFO, CoinGape, CryptoNews, and Business2Community


