

Last week, Ethereum gained notable strength and briefly moved above $2,100. This temporarily restored confidence among market participants. However, the breakout has not yet proven sustainable. ETH is now trading again near the key psychological level of $2,000, which is considered a crucial support zone.
Ethereum price struggles to hold $2,000
The recent move above $2,100 created fresh market momentum, but the rally quickly lost strength. The asset was rapidly sold off and returned to the $2,000 area, which is now viewed as a critical support level.
An analysis of order-flow data helps explain this dynamic. The latest price movement was largely driven by the derivatives market. Trading volumes in futures and other leveraged instruments increased significantly more than volumes in the spot market.
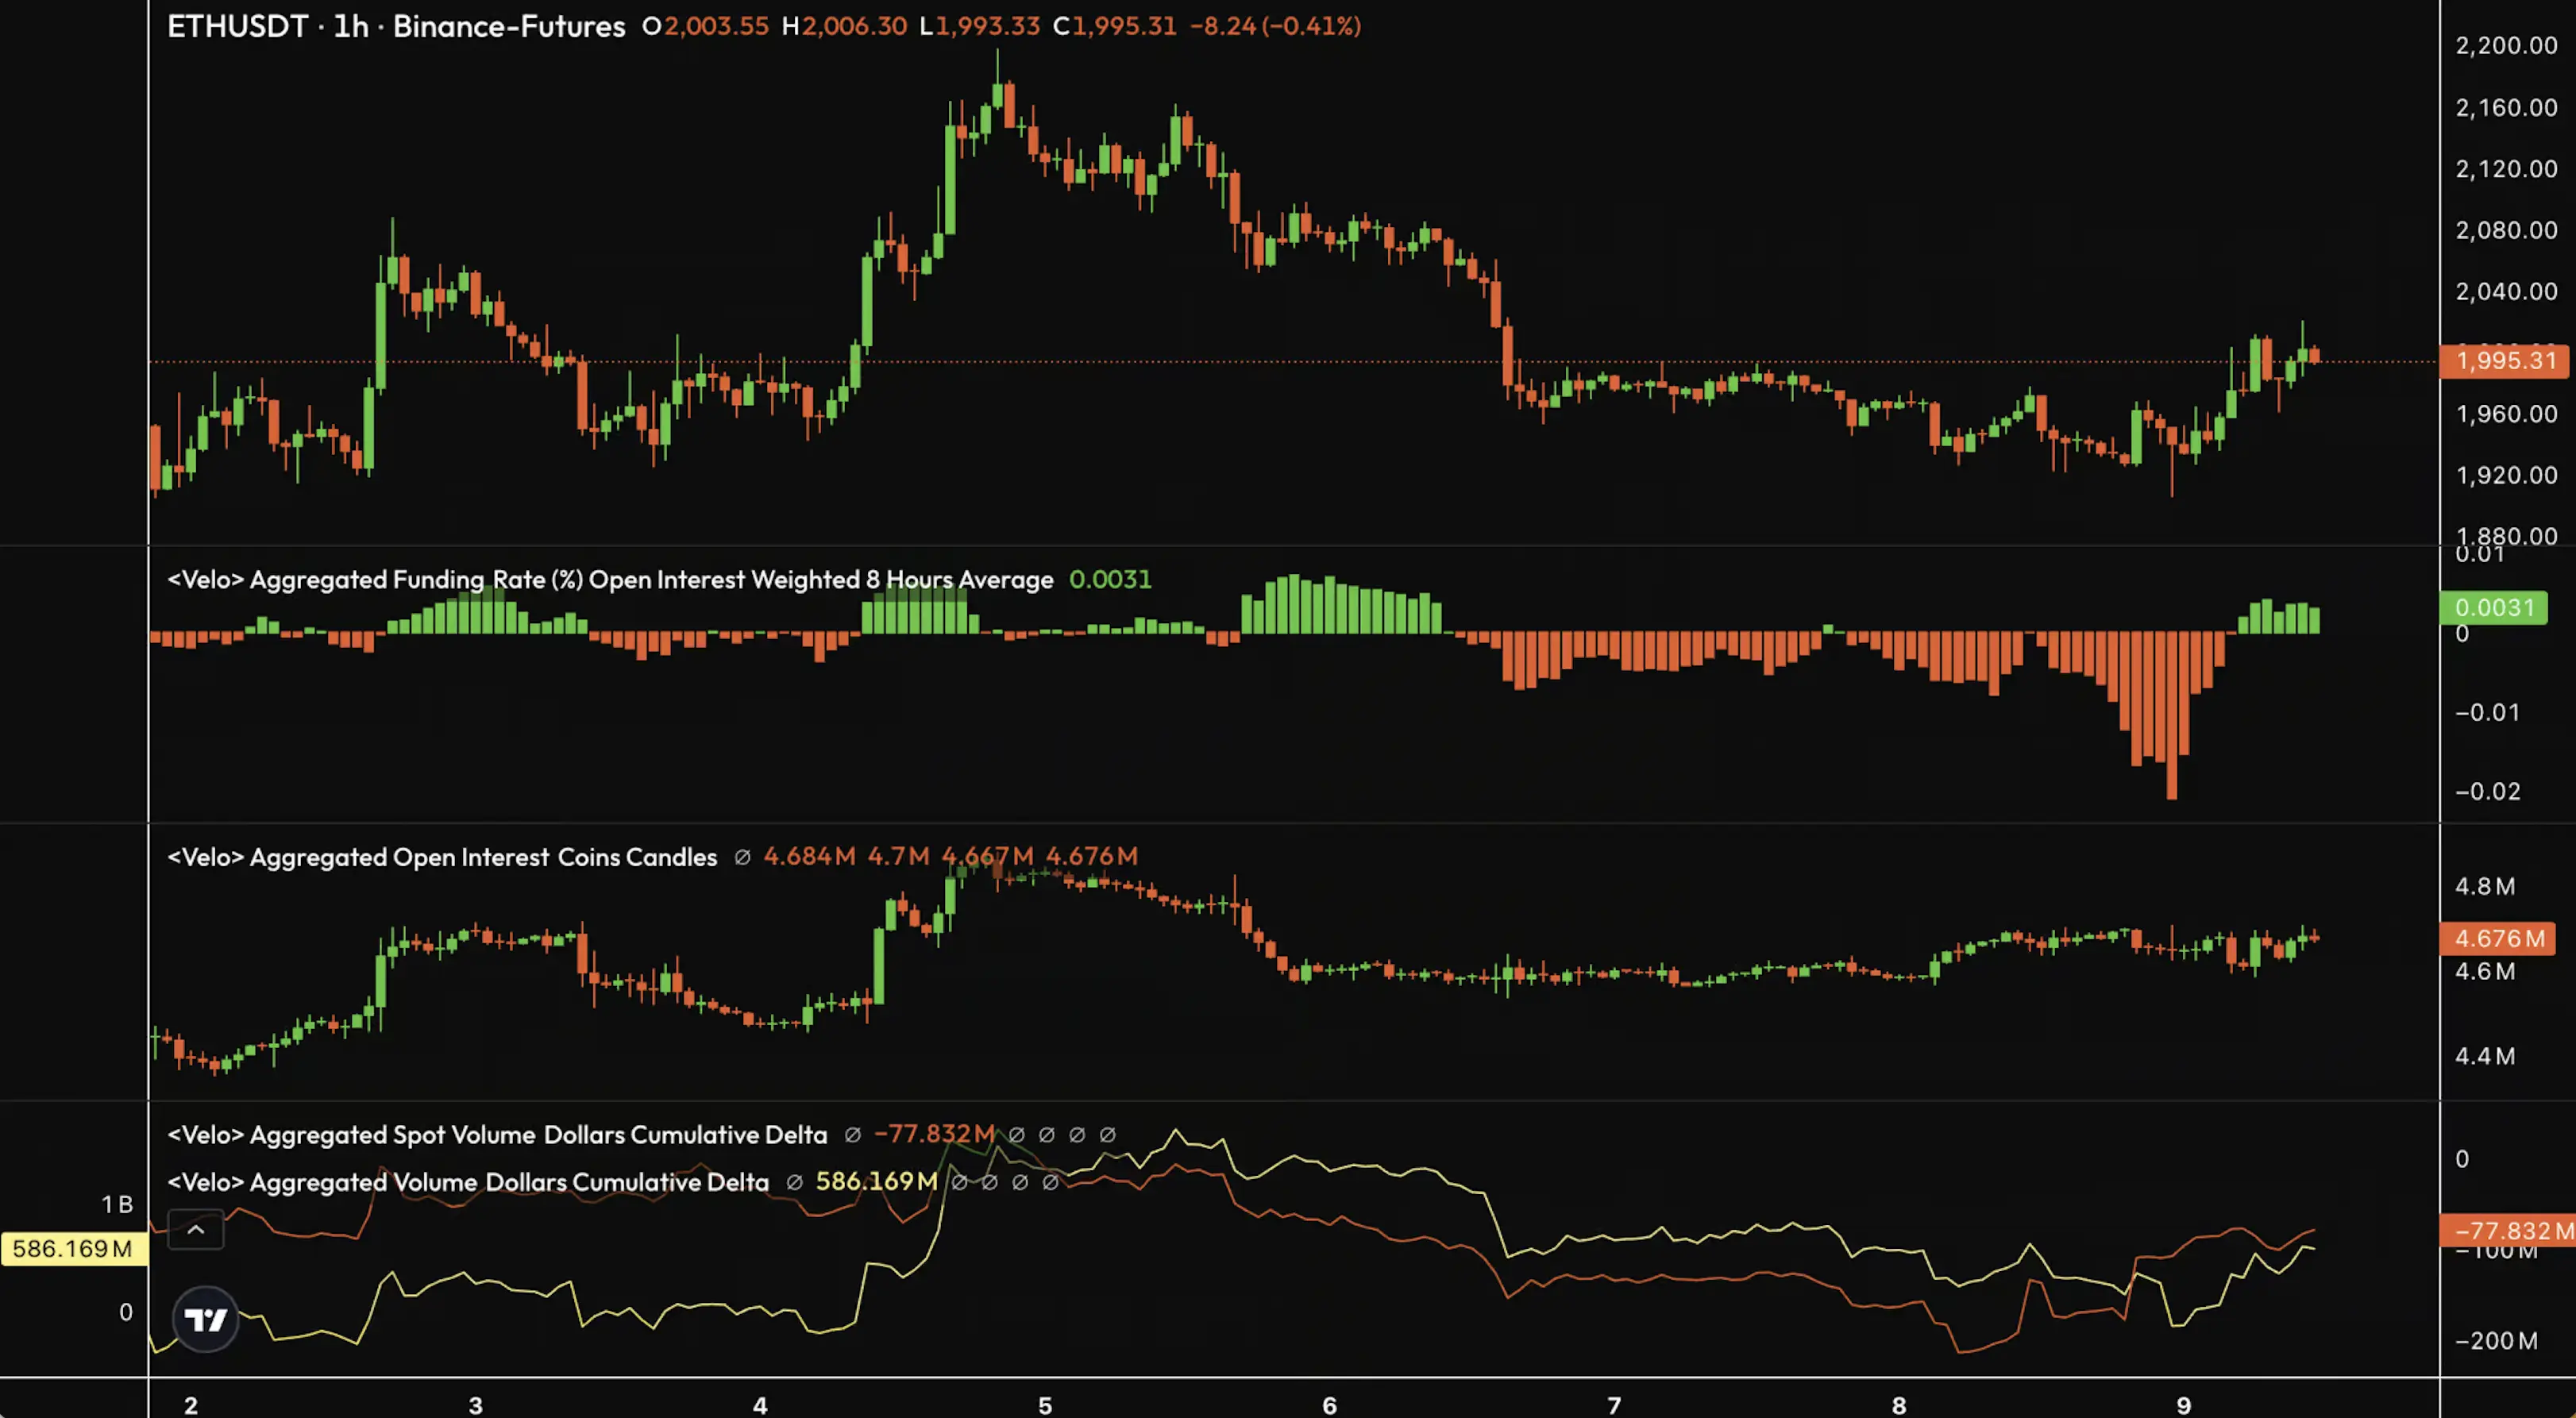
This suggests the rally was primarily triggered by leveraged long positions rather than genuine spot demand for Ethereum. Such movements can generate sharp short-term price spikes, but they are often vulnerable to rapid corrections.
When a rally is mainly supported by derivatives traders, the likelihood increases that profits will be quickly taken or positions closed. These dynamics can cause upward momentum to fade rapidly and lead to a correction. This once again highlights the importance of strong spot demand for a sustainable uptrend.
Geopolitical tensions continue to weigh on the market
One of the key factors behind the current uncertainty remains the geopolitical environment. The ongoing conflict between the United States and Iran continues to create nervousness across global financial markets.
Investors are particularly concerned about the sharp rise in oil prices. Higher energy costs could intensify inflationary pressure and influence central bank monetary policy decisions. Such developments also affect the crypto market, making it more sensitive to short-term volatility.
On-chain data shows mixed signals
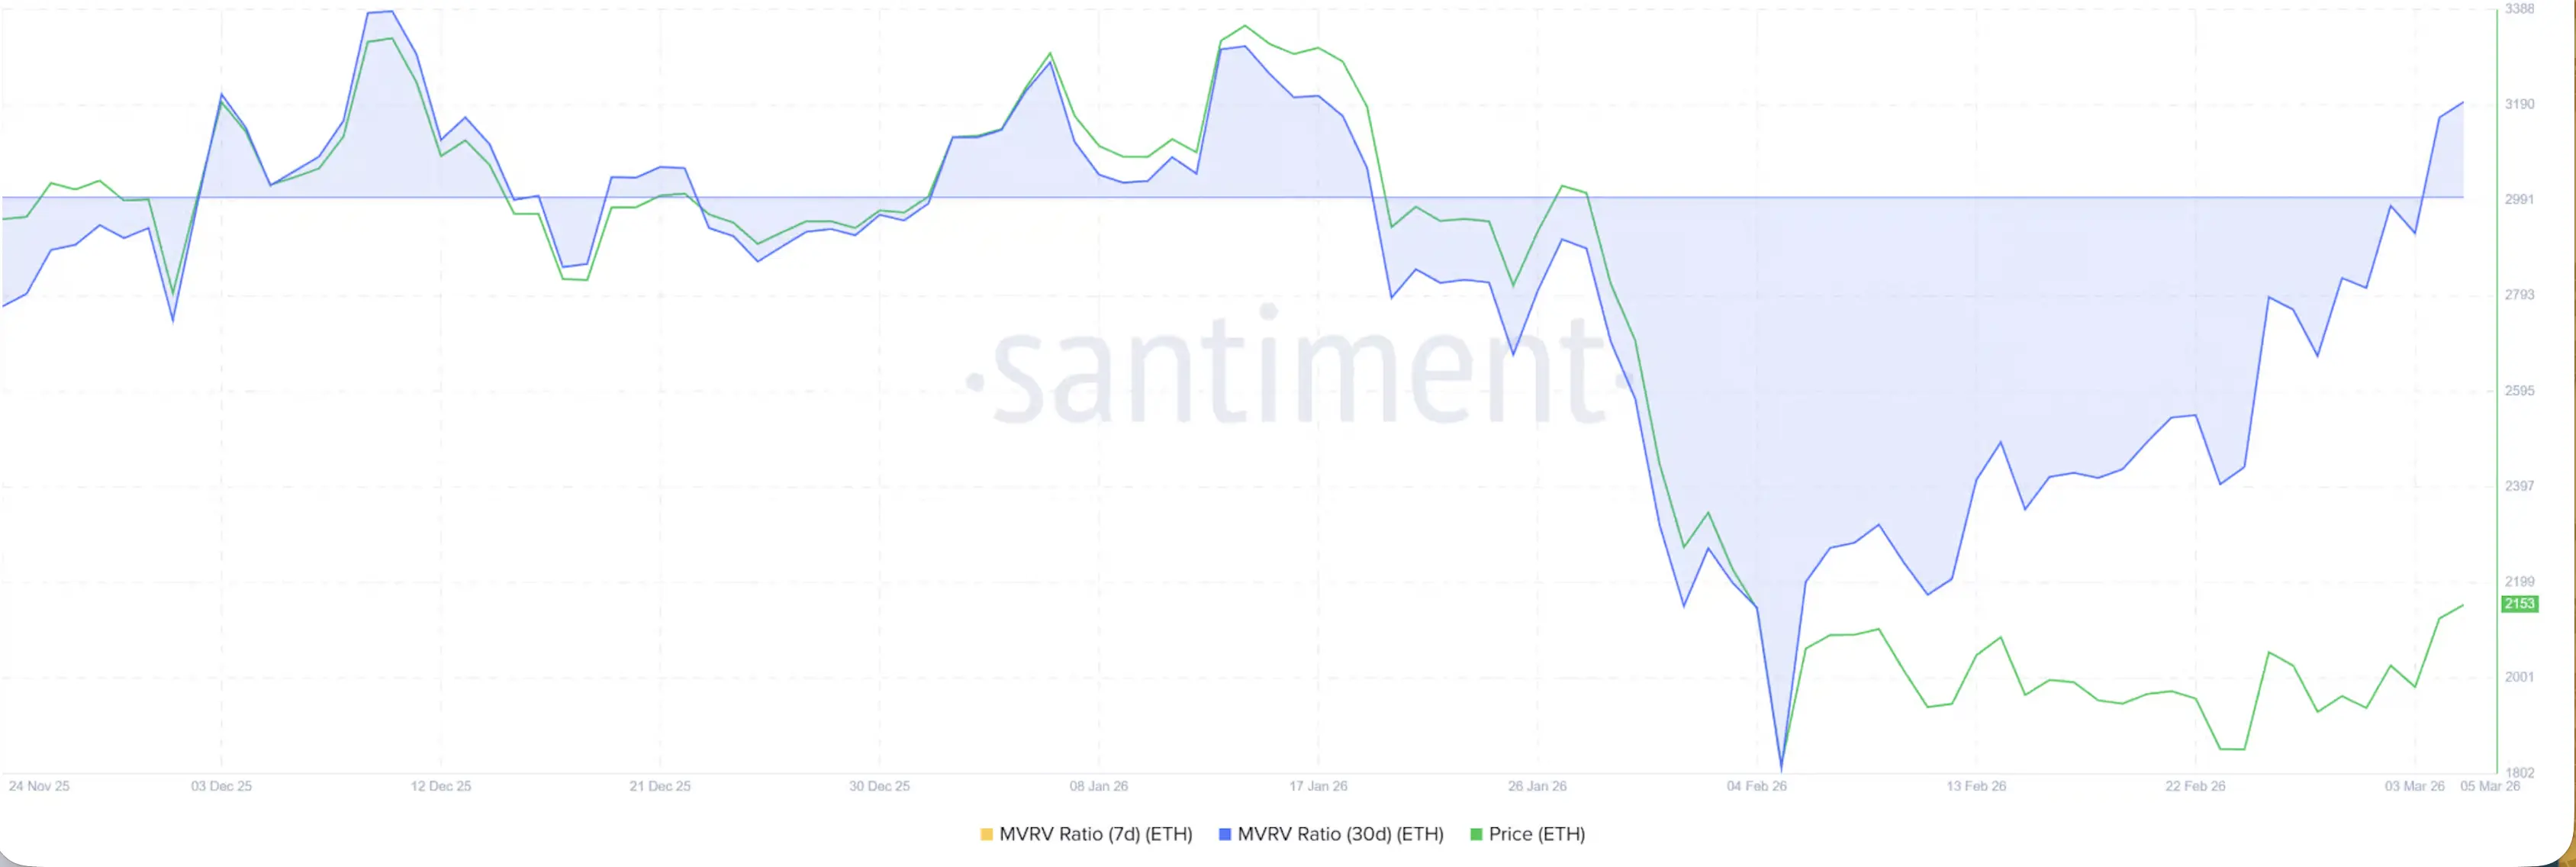
An analysis of blockchain metrics also fails to provide a clear directional signal. One of the key indicators is the MVRV ratio (Market Value to Realized Value), which measures the relationship between the current market value and the realized value of coins.
Recently, Ethereum’s MVRV ratio moved back into positive territory for the first time in about one and a half months. Normally, such a move is interpreted as a bullish signal because it indicates that investors are returning to profit.

However, in a fragile market environment, a rising MVRV can also have the opposite effect. When investors return to profit, the incentive to realize gains often increases. Short-term traders in particular may use the recent price movement to sell assets or offset earlier losses. In such a scenario, Ethereum could once again face renewed selling pressure.
Long-term investors continue accumulating ETH
While short-term traders appear cautious, long-term investors are behaving differently. The Net Position Change metric for HODLers suggests that long-term holders have recently continued increasing their Ethereum positions.
This accumulation signals confidence in Ethereum’s long-term development. Investors with longer investment horizons are generally less sensitive to short-term volatility and do not sell their holdings during every market fluctuation.
During periods of uncertainty, such investors often play a stabilizing role. Their buying activity can act as a form of safety net for the market by absorbing large selling waves.
Ethereum price: key levels to watch
Liquidation data also provides clues about potential short-term price movements. The liquidation heatmap currently shows significant liquidity zones both above and below the current price.
However, a noticeably larger concentration of liquidity sits below the current market level. The area around $1,900 stands out in particular. Such zones often attract price action because many leveraged positions can be liquidated there.
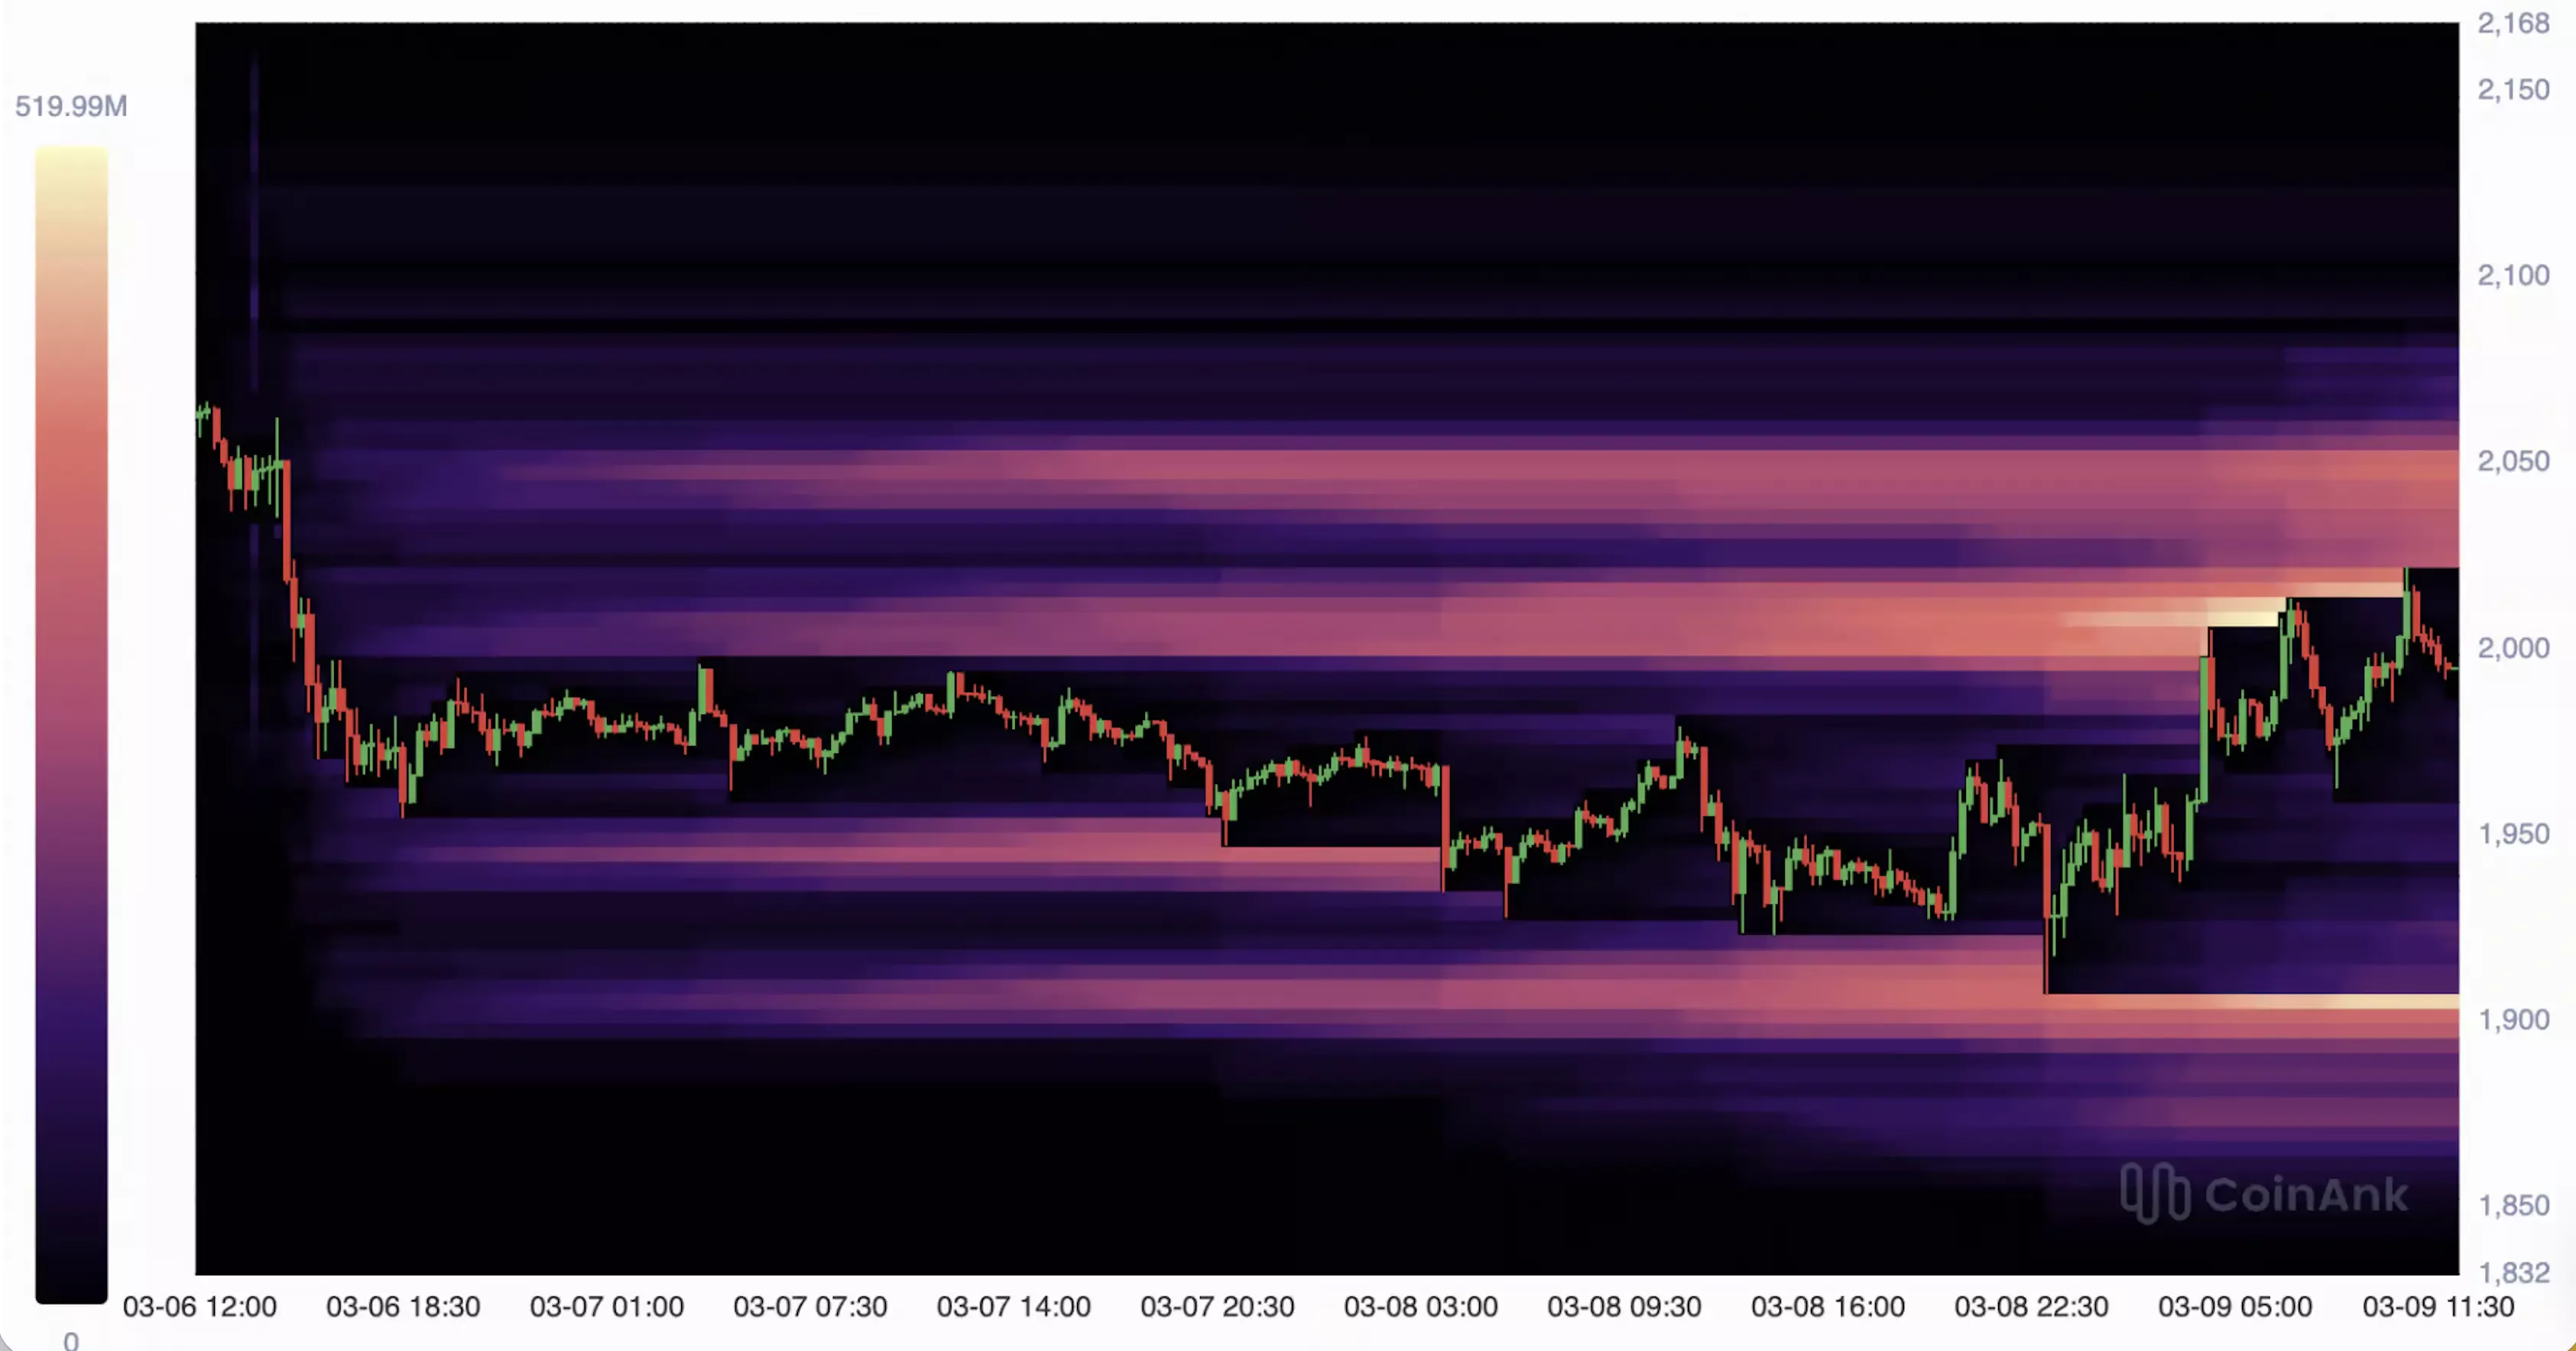
Therefore, a short-term test of the $1,900 zone cannot be ruled out.
On the upside, the key resistance remains around $2,100. If the market manages to break above this level again, it could trigger a new wave of buying momentum.
Outlook: critical levels for ETH
The current market structure shows that Ethereum is in a sensitive phase. As long as the $2,000 level is not firmly confirmed as support, the market remains vulnerable to further pullbacks.
A short-term test of the $1,900 area therefore appears possible. At the same time, the outlook could quickly improve if geopolitical tensions ease and confidence returns to the market.
If Ethereum manages to defend the $2,000 level and move back above $2,100, bullish momentum could quickly return.
