

The market remains in a state of uncertainty ahead of the final U.S. Federal Reserve meeting of the year, with the decision set to be announced on December 10. Most analysts expect the regulator to cut interest rates once again by 25 basis points to 3.75%.
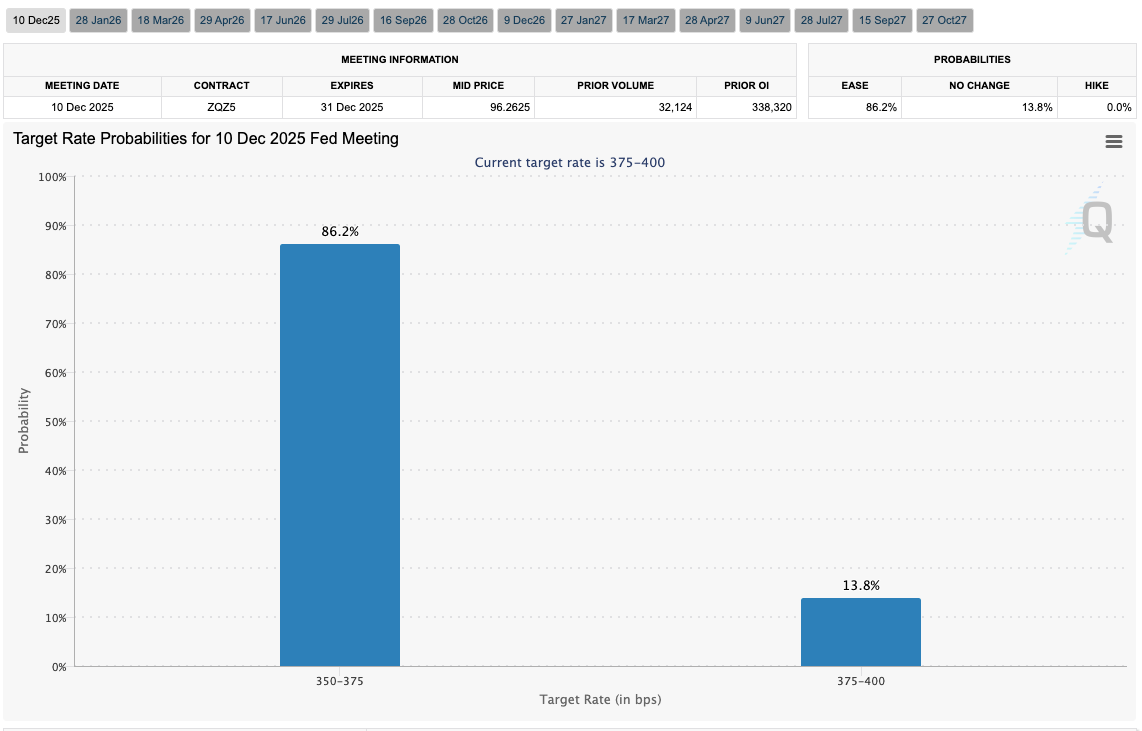
Current U.S. macro conditions support such a decision: the labor market shows cooling signs (unemployment in September rose from 4.3% to 4.4%, and employment, according to ADP, fell by 32,000 in November), indicating the need for monetary support. At the same time, inflation continues to ease, although it remains far from the 2.0% target: the core Personal Consumption Expenditures (PCE) price index declined from 2.9% to 2.8% in September. Under these conditions, the probability of a rate cut, according to the CME FedWatch Tool, stands at nearly 90.0%, although a small chance remains that policymakers may refrain from major action — especially considering Jerome Powell’s earlier comments that many FOMC members prefer to wait and observe the effects of previously implemented measures.
Currently, BTC/USD quotes are rising, but gains are limited by a negative market response to the U.S. National Security Strategy published on Friday. Despite President Donald Trump’s friendly stance toward digital assets, neither crypto nor blockchain technologies were mentioned in the document, while artificial intelligence and quantum computing were emphasized as “critical technologies” for national interests — disappointing investors. Medium-term sentiment in the crypto market also remains bearish, reflected by capital outflows from key exchange-traded funds (Bitcoin ETF outflows totaled $87.7 million last week) and the Fear and Greed Index sitting in the “extreme fear” zone at 20 points.
Against this backdrop, a significant rise in BTC/USD in the coming weeks appears unlikely, even if the Federal Reserve adopts a softer monetary stance.
Support and Resistance Levels
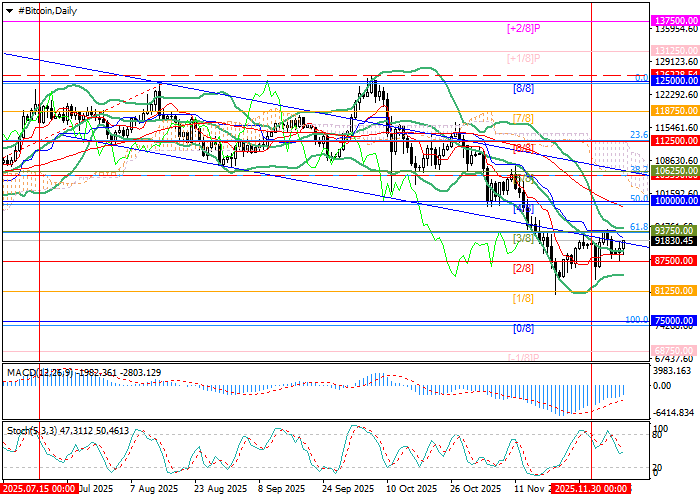
The asset remains within a long-term downtrend but is attempting a short-term rebound. A breakout above 93,750.00 (Murray level [3/8], Fibonacci 61.8% correction, upper Bollinger Band) opens the path toward 100,000.00 (Murray level [4/8], Fibonacci 50.0% correction). The critical level for bears is 87,500.00 (Murray level [2/8]). A breakdown below it would signal movement toward 75,000.00 (Murray level [0/8]) and 68,750.00 (Murray level [–1/8]).
Technical indicators signal potential continued bearish pressure: Bollinger Bands are flat, Stochastic is trending downward, and MACD remains stable in the negative zone.
Resistance levels: 93,750.00, 100,000.00, 106,250.00.
Support levels: 87,500.00, 75,000.00, 68,750.00.
BTC/USD Trading Scenarios and Forecast
Short positions may be opened below 87,500.00 or after a reversal near 100,000.00 with targets at 75,000.00 and 68,750.00 and stop-losses at 92,300.00 and 104,000.00, respectively. Estimated execution time: 5–7 days.
Scenario
| Timeframe | Weekly |
| Recommendation | SELL STOP |
| Entry Point | 87,450.00 |
| Take Profit | 75,000.00, 68,750.00 |
| Stop Loss | 92,300.00 |
| Key Levels | 68,750.00, 75,000.00, 87,500.00, 93,750.00, 100,000.00, 106,250.00 |
Alternative Scenario
| Recommendation | SELL LIMIT |
| Entry Point | 100,000.00 |
| Take Profit | 75,000.00, 68,750.00 |
| Stop Loss | 104,000.00 |
| Key Levels | 68,750.00, 75,000.00, 87,500.00, 93,750.00, 100,000.00, 106,250.00 |
