

Overall, market conditions remain relatively stable, while investors continue to favor precious metals, whose prices are setting fresh all-time highs. Gold and silver are attracting traders as safe-haven assets amid concerns over potential instability following the expected replacement of Federal Reserve Chair Jerome Powell with White House economic adviser Kevin Hassett. Markets anticipate that Hassett could initiate a more aggressive easing of monetary policy, increasing inflation risks. In addition, demand for silver is being supported by its growing industrial use, particularly in the defense sector. All these factors contribute to persistently negative sentiment in the cryptocurrency market, as evidenced by continued outflows from major digital ETFs. Last week, Bitcoin-ETF holdings declined by $782.0 million, while the Fear & Greed Index has remained in the “extreme fear” zone at 24 for more than two weeks.
Under these conditions, a meaningful recovery in BTC/USD in the near term appears unlikely.
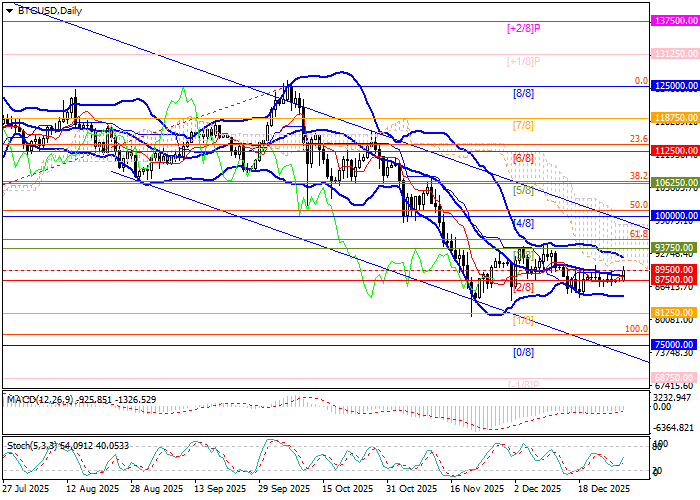
Support and resistance levels
Despite the recent rebound, the instrument remains confined within the 87,500.00–89,500.00 range, capped by the Murray level [2/8] and the middle line of the Bollinger Bands, and continues to trade within a medium-term downtrend. A downside break below 84,365.00 (the area of December lows) could open the way for further losses toward 75,000.00 (Murray level [0/8]) and 68,750.00 (Murray level [–1/8]). Conversely, a breakout above the upper Bollinger Band at 93,750.00 (Murray level [3/8]) would allow prices to exit the descending channel and resume growth toward 100,000.00 (Murray level [4/8]) and 106,250.00 (Murray level [5/8]).
Technical indicators are mixed: the Bollinger Bands are turning lower, the MACD histogram remains in negative territory, while the Stochastic oscillator is starting to turn upward.
Resistance levels: 93,750.00, 100,000.00, 106,250.00.
Support levels: 84,365.00, 75,000.00, 68,750.00.
Trading scenarios and BTC/USD outlook
Short positions can be opened below 84,365.00 with targets at 75,000.00 and 68,750.00, and a stop-loss at 90,600.00. Time horizon: 5–7 days.
Long positions can be opened above 93,750.00 with targets at 100,000.00 and 106,250.00, and a stop-loss at 88,600.00.
Scenario
| Timeframe | Intraday |
| Recommendation | SELL STOP |
| Entry point | 84,300.00 |
| Take Profit | 75,000.00, 68,750.00 |
| Stop Loss | 90,600.00 |
| Key levels | 68,750.00, 75,000.00, 84,365.00, 93,750.00, 100,000.00, 106,250.00 |
Alternative scenario
| Recommendation | BUY STOP |
| Entry point | 93,800.00 |
| Take Profit | 100,000.00, 106,250.00 |
| Stop Loss | 88,600.00 |
| Key levels | 68,750.00, 75,000.00, 84,365.00, 93,750.00, 100,000.00, 106,250.00 |
