

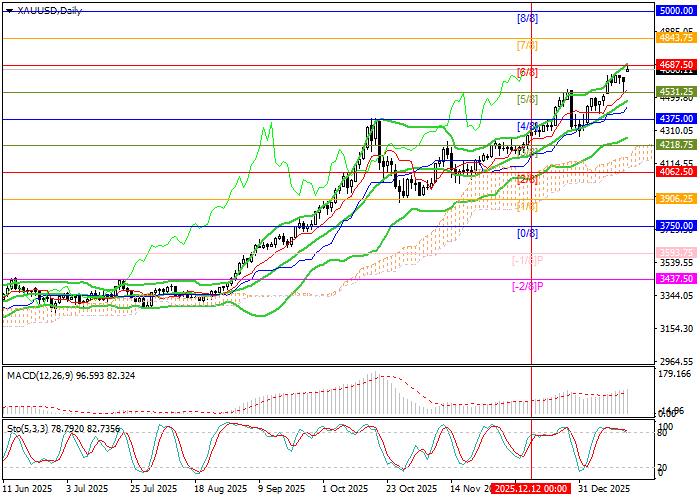
Today, the price is testing the 4,687.50 level (Murray level [6/8]) amid a sharp escalation in tensions between the US and the EU. Over the weekend, US President Donald Trump announced the introduction of an additional 10.0% tariff from February 1 on exports from Denmark, Sweden, France, Germany, the Netherlands, and Finland—countries that have taken an active stance against Greenland joining the United States. Should the current political position persist, trade tariffs could be raised to 25.0% in June.
In response, the EU, under its previously developed Anti-Coercion Instrument, is preparing to impose retaliatory tariffs on US goods worth up to €93.0 billion, along with a significant tightening of general market access rules for US companies operating in Europe. In addition, the United Kingdom and Norway—neither of which are EU members—have also announced plans to develop their own trade sanctions against the United States.
Investors fear that further escalation could substantially increase pressure on global trade and contribute to a slowdown in global economic growth, which is already weighing on demand for risk assets. Many analysts do not rule out a scenario in which markets revisit the April 2025 lows, when the Republican administration in Washington first announced a broad-based increase in trade tariffs. Under these conditions, the upside potential for traditional safe-haven assets—most notably precious metals—remains intact.
Support and Resistance Levels
The instrument is testing the 4,687.50 level (Murray level [6/8]); a firm breakout above this area would open the way for further gains toward 4,843.75 (Murray level [7/8]) and 5,000.00 (Murray level [8/8]). The key level for bears remains 4,375.00 (Murray level [4/8]), located below the middle line of the Bollinger Bands. A downside breakout there would likely resume the decline toward 4,062.50 (Murray level [2/8]) and 3,906.25 (Murray level [1/8]).
Technical indicators generally confirm the persistence of the bullish trend: Bollinger Bands are pointing upward, MACD is rising in positive territory, and the Stochastic oscillator is preparing to exit the overbought zone. At the same time, price action and MACD show signs of a potential bearish divergence, which does not rule out a corrective pullback, although its downside potential appears limited.
Resistance levels: 4,687.50, 4,843.75, 5,000.00.
Support levels: 4,375.00, 4,062.50, 3,906.25.
Trading Scenarios and XAU/USD Outlook
Long positions may be considered above the 4,687.50 level with targets at 4,843.75 and 5,000.00, and a stop-loss at 4,565.00. Time horizon: 5–7 days.
Short positions may be considered below the 4,375.00 level with targets at 4,062.50 and 3,906.25, and a stop-loss at 4,500.00.
