
In addition, at 12:00 (GMT+2) markets will receive producer price index data — a key inflation indicator reflecting changes in prices for goods and raw materials. On a monthly basis the index is expected to rise from –0.3% to 0.2%, while on an annual basis it may slow from –2.1% to –2.7%. Nevertheless, this is unlikely to significantly affect expectations regarding future monetary policy. It should be recalled that the European Central Bank (ECB) currently does not plan to reduce borrowing costs this year, expecting consumer inflation to remain within the target range of 2.0–3.0%.
The key event on Tuesday was the release of preliminary February inflation data: the indicator accelerated from –0.6% to 0.7% on a monthly basis and from 1.7% to 1.9% year-over-year, while the core figure rose from –1.1% to 0.8% month-over-month and from 2.2% to 2.4% annually. However, the overall trend is raising concerns among analysts because it could intensify further due to rising oil prices linked to the military confrontation between Iran and the United States. Tehran’s response to strikes on the country’s infrastructure — including events that reportedly resulted in the death of Ayatollah Ali Khamenei and more than forty senior military officials — triggered not only missile launches toward Israeli territory and strategic targets across the region, including US bases in Bahrain, Qatar, Kuwait and the United Arab Emirates, as well as the UK’s Akrotiri base in Cyprus, but also led to the blockade of the Strait of Hormuz, through which around 20% of global energy supplies pass. The escalation pushed Brent crude prices up more than 8.0% in just two days, while gas prices in the European Union surged by about 50.0%.
This situation could lead to a “significant acceleration” of inflation, according to ECB Chief Economist Philip Lane. In his assessment, rising energy costs create clear upward pressure on inflation in the short term while simultaneously weakening economic growth prospects. The scale of the macroeconomic shock will depend on the duration and depth of supply disruptions, while a reassessment of risks could amplify negative effects through tighter financial conditions, widening credit spreads, and higher risk premiums across eurozone assets. According to Lane, the regulator intends to closely monitor developments, including scenarios outlined in an ECB analytical report from December 2023 that considered the possibility of losing roughly one-third of oil and gas flows through the Strait of Hormuz. Under such a scenario, prices could rise from 80.0$ per barrel to 130.0$. For the eurozone economy this would mean a reduction in economic growth by about 0.6 percentage points in the following year and an increase in inflation by more than 0.8 percentage points, raising the risk of stagflation and limiting the room for monetary easing.
Meanwhile, US investors will focus at 15:15 (GMT+2) on the release of ADP employment data, which is based on surveys of approximately 400,000 businesses. Forecasts suggest an increase of around 50,000 jobs, more than double January’s reading. Later, at 21:00 (GMT+2), the US Federal Reserve will publish its Beige Book economic report, which provides detailed information about business activity across different regions of the country and includes data on industry, agriculture, corporate and consumer spending, real estate markets, and other current economic indicators.
Support and resistance levels
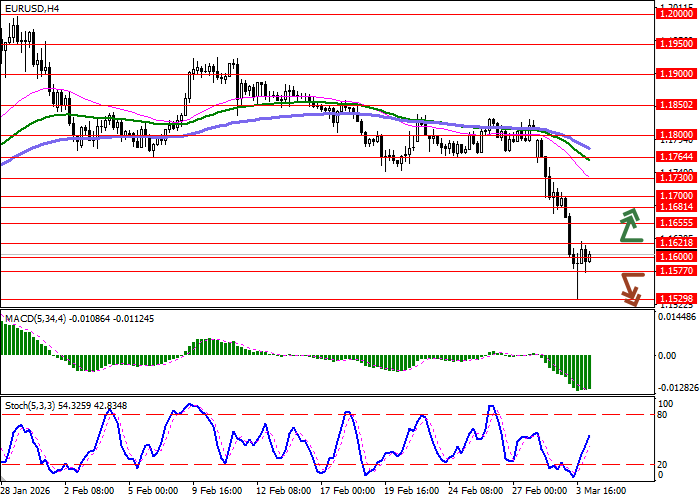
On the daily chart, Bollinger Bands are showing a confident downward trend, with the price range expanding but still lagging behind the recent surge in bearish sentiment. MACD maintains a firm sell signal, remaining below its signal line. Stochastic shows similar dynamics, although the indicator line is approaching oversold territory, suggesting the euro may face short-term oversold risks.
Resistance levels: 1.1621, 1.1655, 1.1681, 1.1700.
Support levels: 1.1600, 1.1577, 1.1529, 1.1500.
Trading scenarios and EUR/USD forecast
Short positions may be considered after a confident breakout below 1.1577 with a target at 1.1500. Stop-loss — 1.1610. Implementation period: 2–3 days.
A return of bullish momentum followed by a breakout above 1.1621 could signal long positions with a target at 1.1700. Stop-loss — 1.1577.
Scenario
| Timeframe | Intraday |
| Recommendation | SELL STOP |
| Entry Point | 1.1575 |
| Take Profit | 1.1500 |
| Stop Loss | 1.1610 |
| Key Levels | 1.1500, 1.1529, 1.1577, 1.1600, 1.1621, 1.1655, 1.1681, 1.1700 |
Alternative Scenario
| Recommendation | BUY STOP |
| Entry Point | 1.1625 |
| Take Profit | 1.1700 |
| Stop Loss | 1.1577 |
| Key Levels | 1.1500, 1.1529, 1.1577, 1.1600, 1.1621, 1.1655, 1.1681, 1.1700 |
