

The key event shaping gold prices was the coordinated military operation launched by the United States and Israel against Iran on February 28, which reportedly resulted in the deaths of several senior figures of the Islamic Republic, including Supreme Leader Ayatollah Ali Khamenei. In response, the Islamic Revolutionary Guard Corps (IRGC) launched Operation “True Promise 4,” targeting US bases in eight countries across the region, including Bahrain, Qatar, the United Arab Emirates (UAE), and Kuwait, as well as Israeli territory and an airbase in Cyprus. In addition, Tehran announced the closure of the Strait of Hormuz, through which around 20.0% of global oil supplies pass, pushing Brent Crude Oil above 85.0 dollars per barrel for the first time since July 2024. US President Donald Trump has insisted there is no clear timeline for the operation, raising expectations of a prolonged conflict and boosting demand for safe-haven assets.
Nevertheless, the precious metal lost more than 4.0% yesterday, falling to its lowest level since early February and erasing the gains recorded after the initial attacks. Analysts attribute this move to the strengthening of the US dollar to a three-month high, as it remains both a traditional safe-haven asset and the currency of an oil-exporting country amid rising crude prices. According to the latest report from the US Commodity Futures Trading Commission (CFTC), the number of net speculative positions stood at 159.2 thousand last week versus 159.9 thousand a week earlier, while traders continued to hold substantial long contracts: the balance of “bullish” positions backed by real money amounted to 122.385 thousand compared with 22.448 thousand for “bears.” Buyers slightly increased their holdings by 2.070 thousand contracts, while sellers reduced theirs by 1.808 thousand contracts.
Labor market data will remain in focus over the coming days, as it could have a significant impact on the metal. Today at 15:15 (GMT+2), ADP will publish its report on nonfarm private payrolls, which is expected to show an increase of 46.0–49.0 thousand versus 22.0 thousand previously. On Thursday at 15:30 (GMT+2), initial jobless claims data will be released, with the number expected at 215.0–216.0 thousand. The key event of the week will be Friday’s February Nonfarm Payrolls report from the US Department of Labor. Economists expect a sharp slowdown to 58.0–60.0 thousand after January’s jump to 130.0 thousand, while the unemployment rate is projected to remain at 4.3% and average hourly earnings at 0.3% month-on-month.
Support and resistance levels
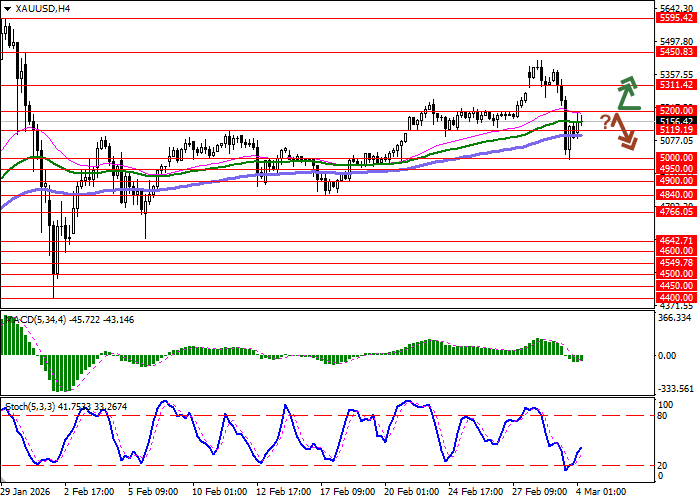
On the daily chart, Bollinger Bands are rising moderately, while the price range is narrowing, reflecting mixed trading conditions in the short term. The MACD indicator has turned downward, forming a sell signal, with the histogram positioned below the signal line, while Stochastic is approaching the “20” level, pointing to the risks of gold becoming oversold in the ultra-short term.
Resistance levels: 5200.00, 5311.42, 5450.83, 5595.42.
Support levels: 5119.19, 5000.00, 4950.00, 4900.00.
Trading scenarios and XAU/USD forecast
Long positions may be opened after a breakout above 5200.00 with a target at 5450.83. Stop-loss — 5100.00. Implementation period: 1–2 days.
Short positions may be opened after a rebound from 5200.00 and a breakout below 5119.19 with a target at 5000.00. Stop-loss — 5200.00.
Scenario
| Timeframe | Intraday |
| Recommendation | BUY STOP |
| Entry Point | 5200.05 |
| Take Profit | 5450.83 |
| Stop Loss | 5100.00 |
| Key Levels | 4900.00, 4950.00, 5000.00, 5119.19, 5200.00, 5311.42, 5450.83, 5595.42 |
Alternative Scenario
| Recommendation | SELL STOP |
| Entry Point | 5119.15 |
| Take Profit | 5000.00 |
| Stop Loss | 5200.00 |
| Key Levels | 4900.00, 4950.00, 5000.00, 5119.19, 5200.00, 5311.42, 5450.83, 5595.42 |
