

Gold prices continue to receive support from the escalation of the conflict in the Middle East. Initially, the Pentagon expected military operations to conclude within a few weeks, but experts now believe that at least 100 days may be required. This increases the likelihood of a global economic slowdown and rising inflation caused by higher energy prices, prompting investors to move capital into safe-haven assets such as gold. Analysts note that the current situation resembles the escalation of tensions between the United States and Iran in 1987, which led to a significant decline in global equity markets.
At the same time, the medium-term upside potential for precious metals is limited by monetary factors, as the US Federal Reserve may maintain current interest rates for a prolonged period or even raise them if inflation accelerates further. In January, the consumer price index reached 2.4% while the producer price index stood at 2.9%, both significantly above the target level of 2.0%. At present, there is no unified stance among Fed officials, although the majority lean toward a hawkish position. An exception is Stephen Miran, who was appointed to the board by President Donald Trump. Speaking on Bloomberg TV, he stated that risks associated with tensions in the Persian Gulf have not changed the need to ease monetary policy this year, as price pressure is expected to continue declining and the labor market requires supportive measures. If the White House manages to strengthen the dovish camp following the appointment of Kevin Warsh as head of the regulator, gold prices could receive a new long-term bullish impulse.
Overall, the prerequisites for further strengthening of the XAU/USD pair remain in place.
Support and resistance levels
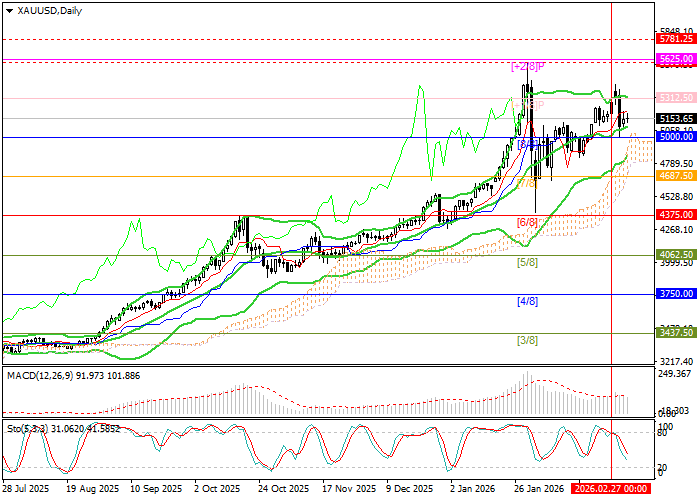
This week the instrument tested the middle line of the Bollinger Bands at 5000.00 (Murray level [8/8]) and resumed growth toward annual highs at 5595.00 and 5781.25 (Murray level [+2/8], H4). However, if the price breaks below the 5000.00 level, quotations may decline toward 4687.50 (Murray level [7/8]) and 4375.00 (Murray level [6/8]).
Technical indicators continue to generate a buy signal. Bollinger Bands are directed upward, the MACD histogram remains stable in the positive zone, while the Stochastic oscillator is pointing downward, suggesting the possibility of a limited correction.
Resistance levels: 5595.00, 5781.25.
Support levels: 5000.00, 4687.50, 4375.00.
Trading scenarios and XAU/USD forecast
Long positions can be opened from the level of 5240.00 with targets at 5595.00 and 5781.25 and a stop-loss at 5050.00. Implementation period: 5–7 days.
Short positions can be opened below the level of 5000.00 with targets at 4687.50 and 4375.00 and a stop-loss at 5250.00.
Scenario
| Timeframe | Weekly |
| Recommendation | BUY STOP |
| Entry Point | 5240.05 |
| Take Profit | 5595.00, 5781.25 |
| Stop Loss | 5050.00 |
| Key Levels | 4375.00, 4687.50, 5000.00, 5595.00, 5781.25 |
Alternative Scenario
| Recommendation | SELL STOP |
| Entry Point | 4999.95 |
| Take Profit | 4687.50, 4375.00 |
| Stop Loss | 5250.00 |
| Key Levels | 4375.00, 4687.50, 5000.00, 5595.00, 5781.25 |
